Course Description
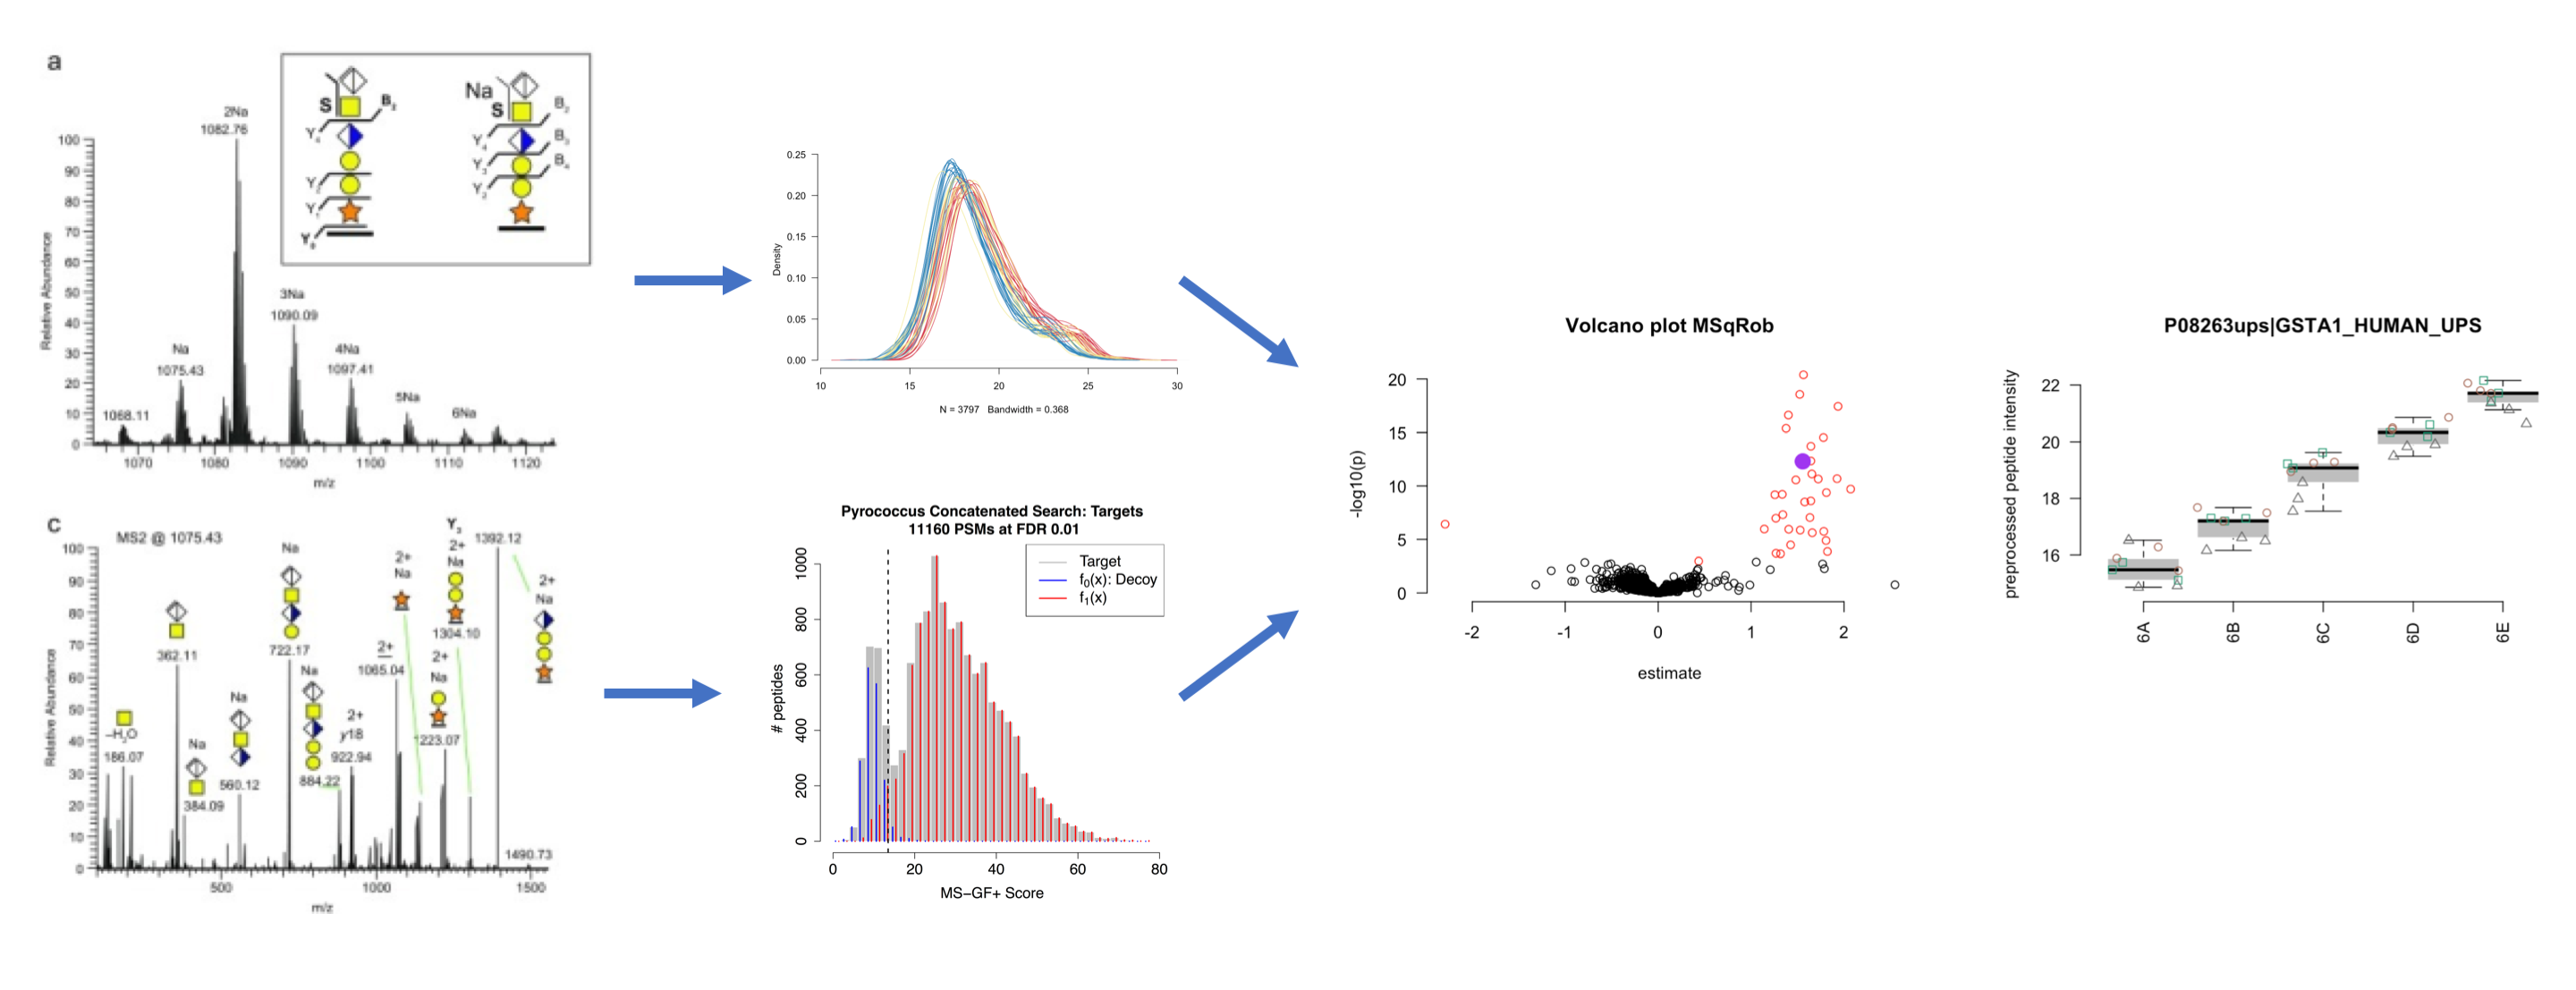
High throughput ‘omics studies generate ever larger datasets and, as a consequence, complex data interpretation challenges. This course focuses on the statistical concepts involved in preprocessing, quantification and differential analysis of high throughput omics data. Moreover, more advanced experimental designs and blocking will also be introduced. The core focus will be on shotgun proteomics and next generation sequencing. The course will rely exclusively on free and userfriendly opensource tools in R/Bioconductor. The course will provide a solid basis for beginners, but will also bring new perspectives to those already familiar with standard data analysis workflows for proteomics and next-generation sequencing applications.
Target Audience
This course is oriented towards biologists and bioinformaticians with a particular interest in differential analysis for quantitative ‘omics.
Prerequisites
The prerequisites for the Statistical Genomics course are the successful completion of a basic course of statistics that covers topics on data exploration and descriptive statistics, statistical modeling, and inference: linear models, confidence intervals, t-tests, F-tests, anova, chi-squared test.
The basis concepts may be revisited in the free e-book Practical Regression and Anova using R of J. Faraway. The book and additional material is freely available on http://www.maths.bath.ac.uk/~jjf23/book/.
- Brief introduction to R: appendix C
- Linear models: Chapter 1-3, 7, 8.1-8.2, 12
- Anova: Chapter 16.1-16.2
Topics
Introduction
- Slides: Intro
- Software: Install and Launch Statistical Software
Part I: Quantitative proteomics
- Bioinformatics for proteomics
- Slides: Bioinformatics for Proteomics
- Students can sharpen their background knowledge on Mass Spectrometry, Proteomics & Bioinformatics for Proteomics here:Mass Spectrometry and Bioinformatics for Proteomics
- Identification
- Preprocessing & Analysis of Label Free Quantitative Proteomics Experiments with Simple Designs
- Slides: Preprocessing
- Tutorial: preprocessing
- Statistical Inference & Analysis of Experiments with Factorial Designs
- Slides: Inference
- Tutorial: Statistical Data Analysis with MSqRob for Factorial Designs
- Technical details of linear models
-
Stagewise testing: Omnibus test and post hoc analysis: slides
- Homework 2: Analysis of the heart example from the tutorial page in 4. Do the analysis with MSqRob. For one protein we will do the analysis with the functions lm, rlm and matrix algebra. Use the rmarkdownfile below as a template.
- Use as name: Namegroupmember1Namegroupmember2Namegroupmember3_SGA2019_Homework2.Rmd
- Homework2.Rmd
- The homework is due by Tuesday 12/11/2019.
Part II: Next-generation sequencing
-
Introduction to transcriptomics with next generation sequencing
- slides: intro
-
tutorial
- Mapping: html,Rmd
- Differential Analysis: html,Rmd, which source of variability is not included in the analysis and how could we account for this? Try to adjust the script accordingly.
- Background for the airway example (count table on small fastQ files available in the Tutorial Data to be prepared by Monday November 4th 2019): Rmd
- Airway entire analysis: genome index Rmd, html, read mapping and count table Rmd,html, DE analysis Rmd, html
-
More Complex Designs
- Researchers assessed the effect of spinal nerve ligation (SNL) on the transcriptome of rats. In this experiment, transcriptome profiling occurred at two weeks and two months after treatment, for both the SNL group and a control group. Two biological replicates are used for every treatment - time combination. The researchers are interested in early and late effects and in genes for which the effect changes over time. The data can be downloaded from the ReCount project website (http://bowtie-bio.sourceforge.net/recount/, dataset Hammer et al.). The following code can be used to download an R/Bioconductor expression set object.
file <- "http://bowtie-bio.sourceforge.net/recount/ExpressionSets/hammer_eset.RData" load(url(file)) hammer.eset-
Paired-end sequencing was performed on primary cultures from parathyroid tumors of 4 patients at 2 time points over 3 conditions (control, treatment with diarylpropionitrile (DPN) and treatment with 4-hydroxytamoxifen (OHT)). DPN is a selective estrogen receptor agonist and OHT is a selective estrogen receptor modulator. One sample (patient 4, 24 hours, control) was omitted by the paper authors due to low quality. Data, the count table and information on the experiment is available at http://www.ncbi.nlm.nih.gov/geo/query/acc.cgi?acc=GSE37211. It is not required to do the read mapping!
-
Submit your RMD scripts via Ufora by Wednesday November 20th 2019
-
Technical details on transcriptomics with next generation sequencing. Generalized linear models are introduced in the slides and bulk RNA-seq tools via their corresponding papers
- slides on GLM
- Poisson GLM and parameter estimation: Rmd, html
- edgeR: Negative Binomial
- DESeq2
- voom
- edgeR: Quasi Negative Binomial
-
DE analysis starting from transcript level counts
- Soneson et al. 2016
- Building index with salmon
salmon index --gencode -t gencode.v32.transcripts.fa -i gencode.v32_salmon_index - Mapping one sample with salmon:
salmon quant -i gencode.v32_salmon_index -l A --gcBias -1 SRR1039508_subset_1.fastq -2 SRR1039508_subset_2.fastq --validateMappings -o quant/SRR1039508_subset_quant - Intro to salmon
- airway with DESeq2: Rmd;html
- airway with EdgeR: Rmd;html
-
Single Cell analysis
- Slides
- Orchestrating Single Cell: workshopVignette, ebook
- Analysis of multi-sample multi-group scRNA-seq data: pseudoBulk
- Project work: See ufora.ugent.be