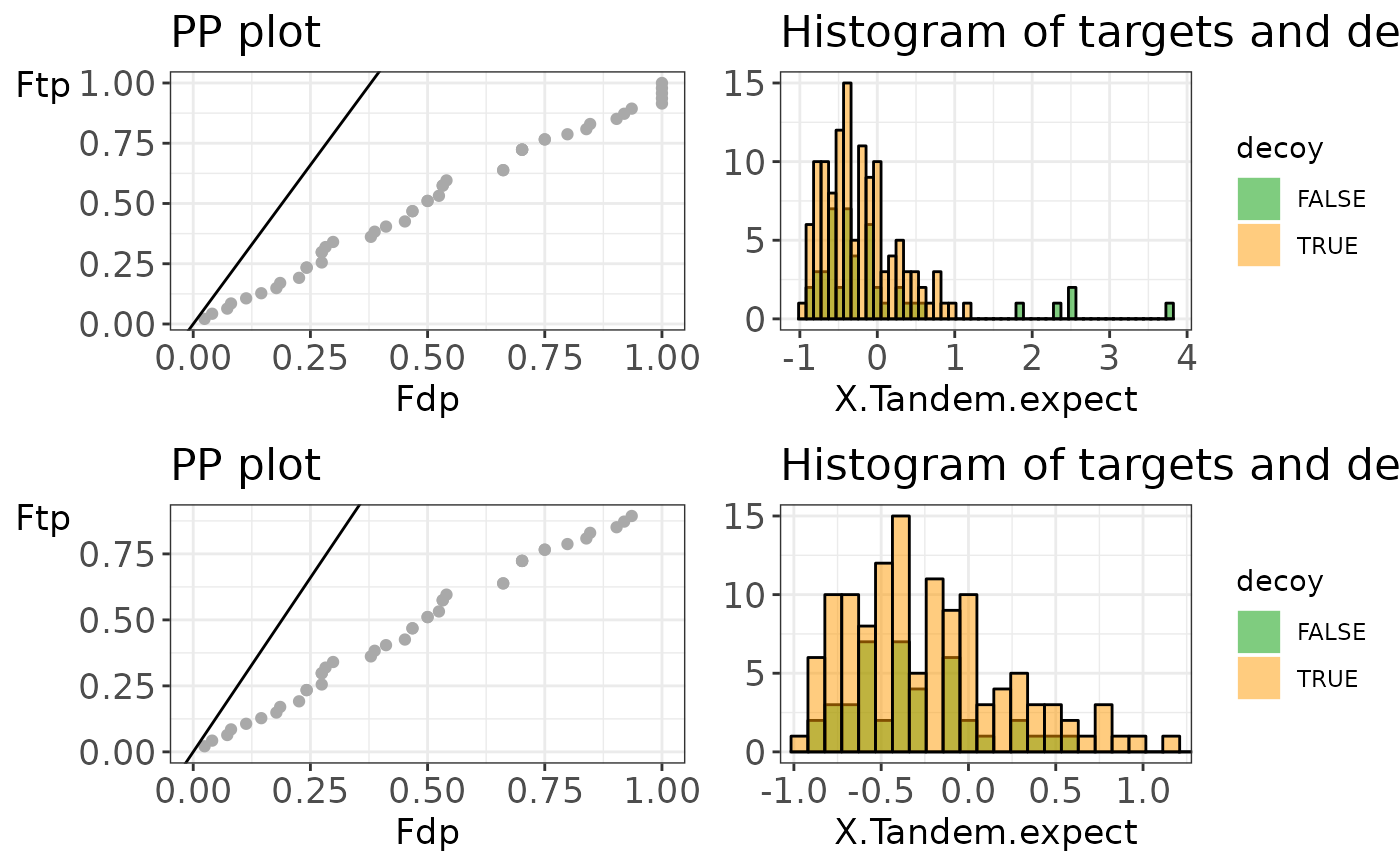
Create diagnostic plots to evaluate the TDA assumptions. A histogram and PP plot allow to check both necessary assumptions.
evalTargetDecoys(
  object,
  decoy = NULL,
  score = NULL,
  log10 = TRUE,
  nBins = 50,
  maxPoints = 1000
)

evalTargetDecoysPPPlot(
  object,
  decoy = NULL,
  score = NULL,
  log10 = TRUE,
  zoom = FALSE,
  maxPoints = 1000
)

evalTargetDecoysHist(
  object,
  decoy = NULL,
  score = NULL,
  log10 = TRUE,
  nBins = 50,
  zoom = FALSE
)
Arguments
- object
- decoy
character, name of the variable that indicates if the peptide matches to a target or to a decoy. When this value is missing, a Shiny gadget is launched to select it interactively.- score
numeric, indicating the score of the peptide match, obtained by the search engine. When this value is missing, a Shiny gadget is launched to select it interactively.- log10
logicalto indicate if the score should be-log10-transformed. Default:TRUE. When this value is missing, a Shiny gadget is launched to select it interactively.- nBins
numericindicating the number of bins in the histogram. When this value is missing, a Shiny gadget is launched to select it interactively.- maxPoints
numericindicating the maximum number of dots shown in the PP plot. IfmaxPointsis larger than the number of target scores, a dot in the PP plot corresponds with each target score in the object. The default is 1000 points.- zoom
Logical value indicating whether a zoomed version of the plot should be returned. Default:
FALSE.
Value
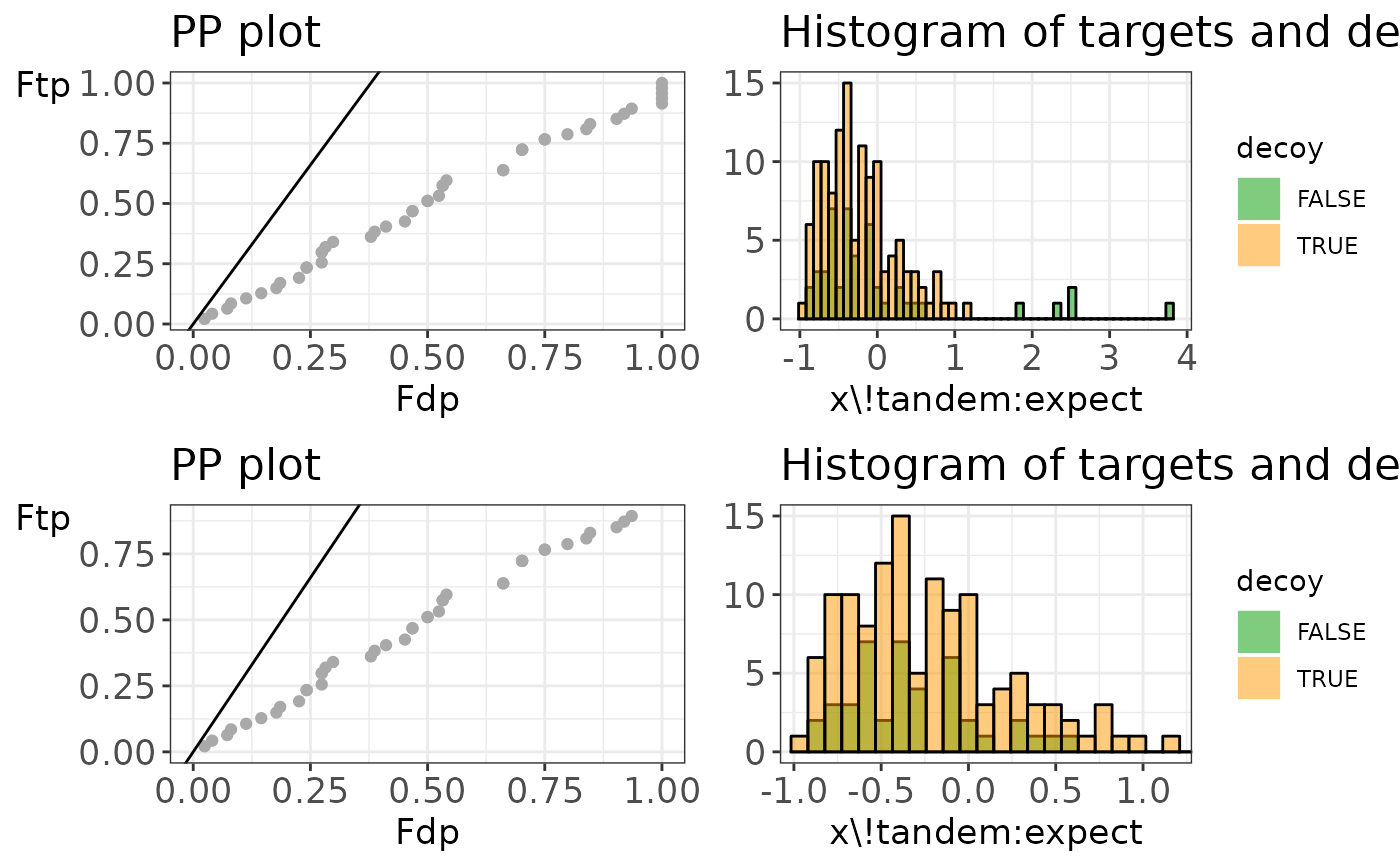
evalTargetDecoys returns an overview of the following four plots:
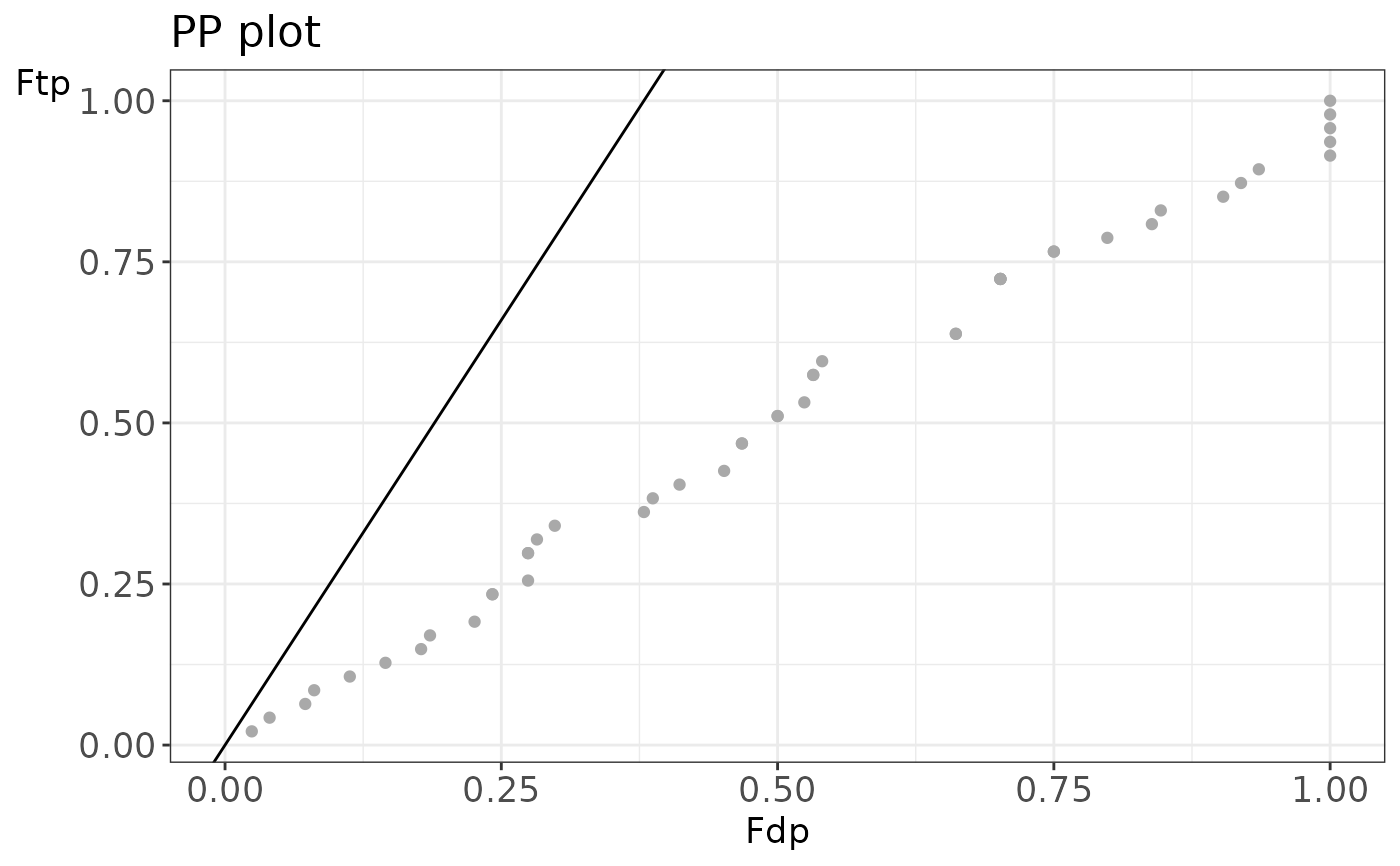
A PP plot showing the empirical cumulative distribution of the target distribution in function of that of the decoy distribution
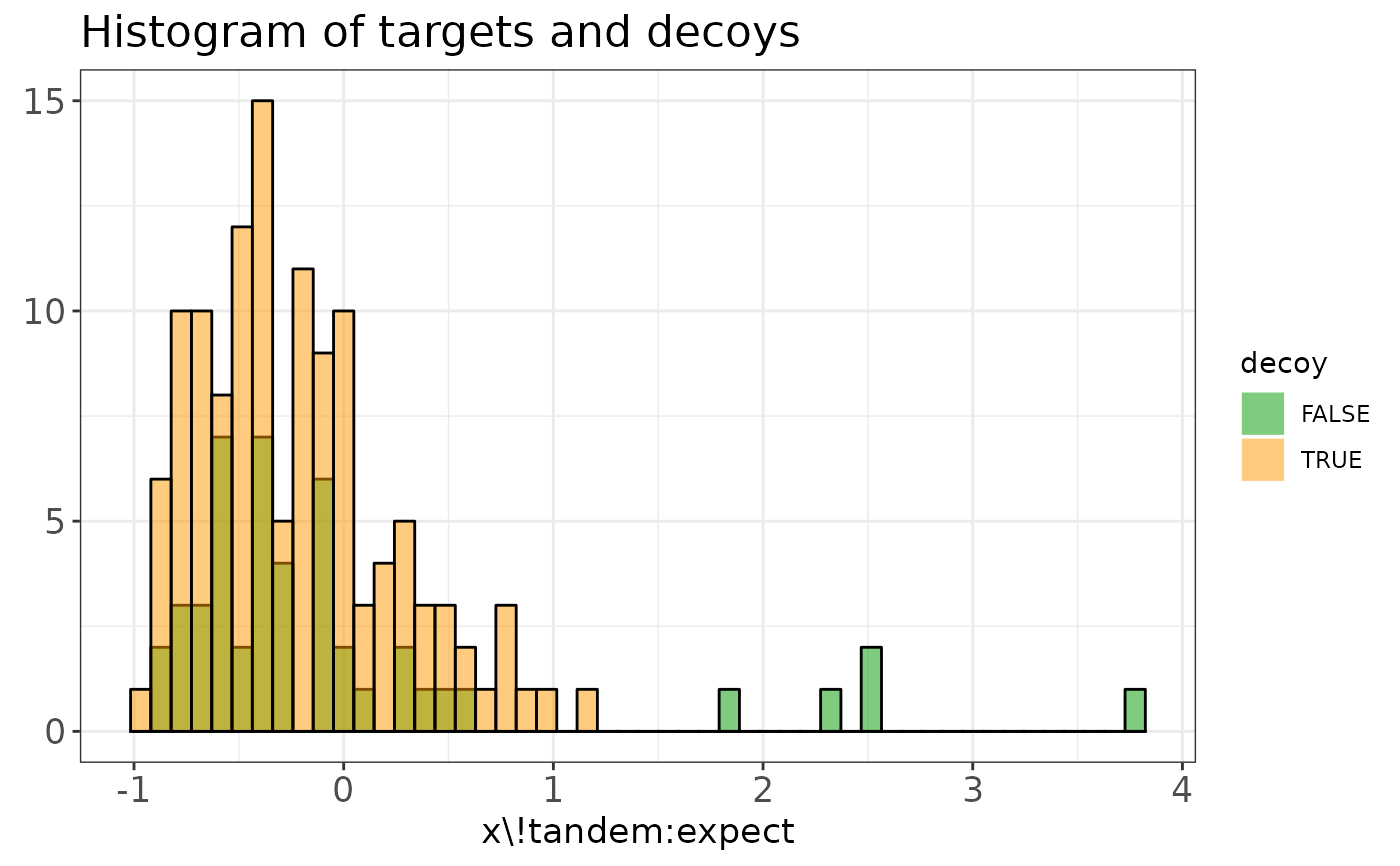
A histogram showing the score distributions of the decoys and non-decoys
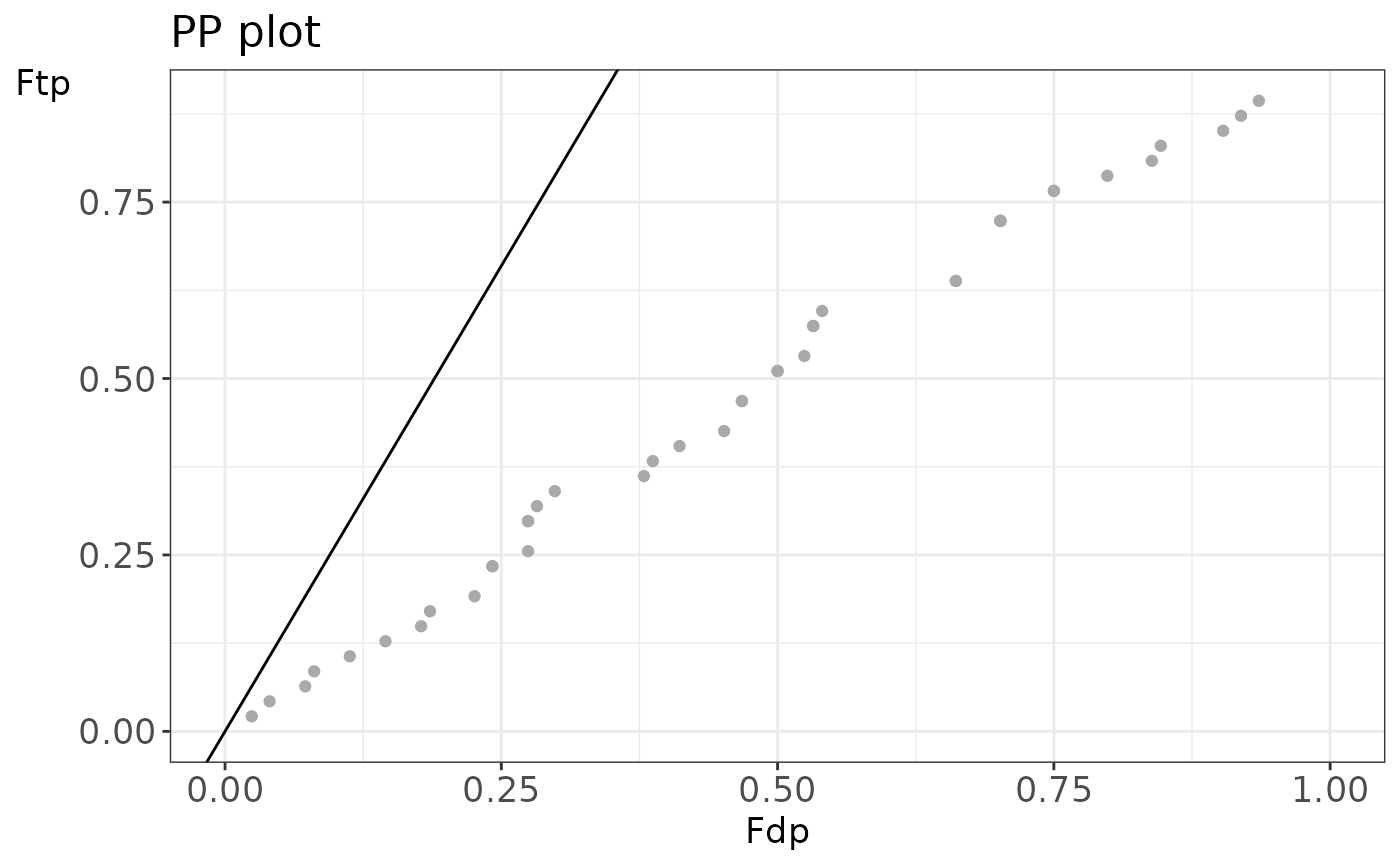
A zoomed PP plot
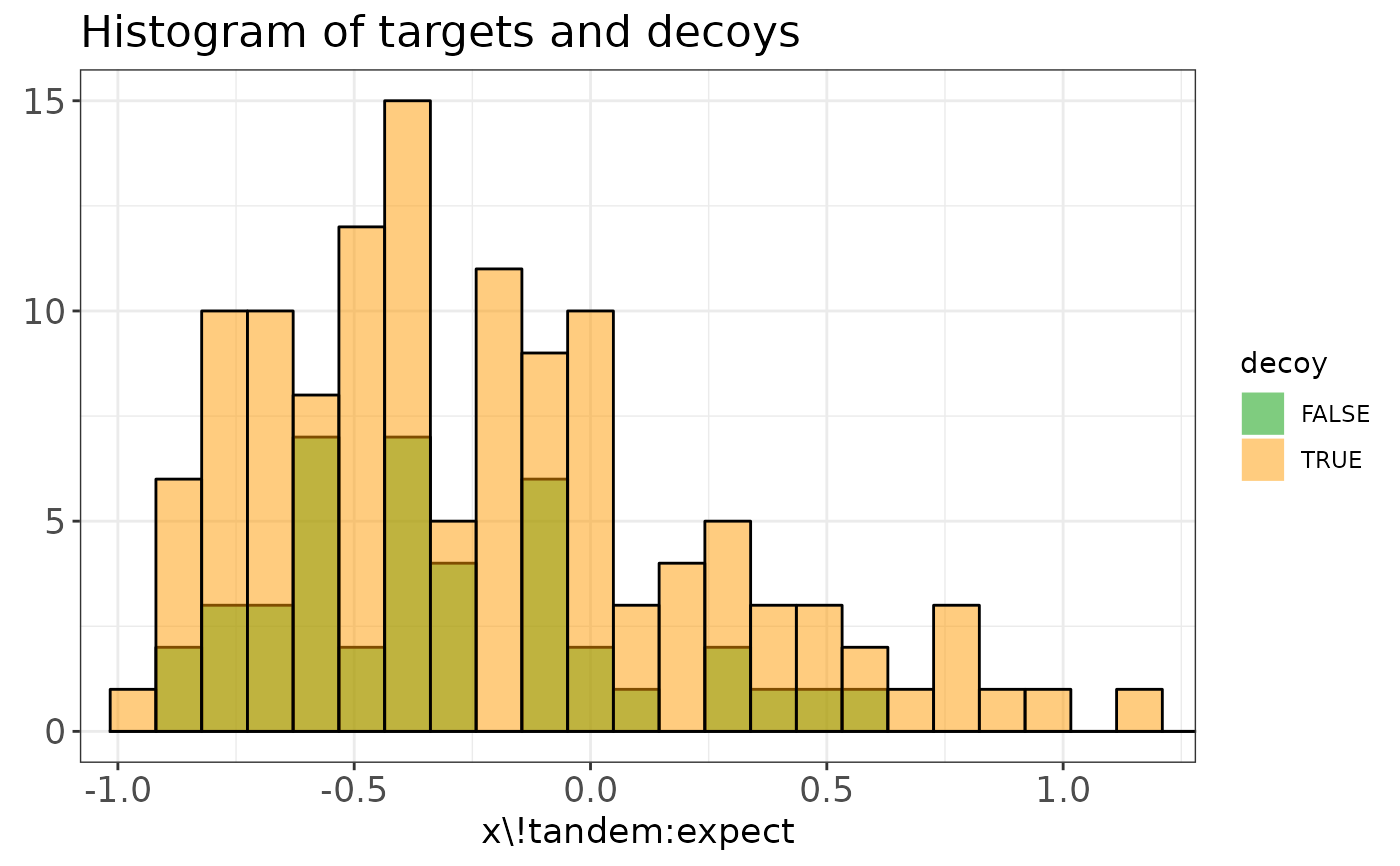
A zoomed histogram
evalTargetDecoysPPPlot generates the PP plot only (1.) or the zoomed
version (3.) if zoom = TRUE.
evalTargetDecoysHist generates the histogram only (2.) or the zoomed
version (4.) if zoom = TRUE.
The Shiny gadget
Sometimes the variable names are not known up front. If this is the case, the
evalTargetDecoys*() functions can be called with only an input object. This
launches a Shiny gadget that allows selecting the variables interactively. A
histogram and PP-plot of the selected variables are created on the fly for
previewing, together with a snapshot of the selected data.
Examples
library(mzID)
## Use one of the example files in the mzID package
exampleFile <- system.file("extdata", "55merge_tandem.mzid", package = "mzID")
mzIDexample <- mzID(exampleFile)
#> reading 55merge_tandem.mzid... DONE!
# Plot the overview of the four plots
evalTargetDecoys(mzIDexample,
decoy = "isdecoy", score = "x\\!tandem:expect", log10 = TRUE
)
 # Plot the PP plot only
evalTargetDecoysPPPlot(mzIDexample,
decoy = "isdecoy", score = "x\\!tandem:expect", log10 = TRUE
)
 # Plot the zoomed PP plot only
evalTargetDecoysPPPlot(mzIDexample,
decoy = "isdecoy", score = "x\\!tandem:expect", log10 = TRUE,
zoom = TRUE
)
 # Plot the histogram only
evalTargetDecoysHist(mzIDexample,
decoy = "isdecoy", score = "x\\!tandem:expect", log10 = TRUE
)
 # Plot the zoomed histogram only
evalTargetDecoysHist(mzIDexample,
decoy = "isdecoy", score = "x\\!tandem:expect", log10 = TRUE,
zoom = TRUE
)
 ## mzRident objects can also be used
library(mzR)
#> Loading required package: Rcpp
if (requireNamespace("msdata", quietly = TRUE)) {
## Using example file from msdata
file <- system.file("mzid", "Tandem.mzid.gz", package = "msdata")
mzid <- openIDfile(file)
}
evalTargetDecoys(mzid,
decoy = "isDecoy", score = "X.Tandem.expect", log10 = TRUE
)
