Plot gene expression in reduced dimension.
Source:R/AllGenerics.R, R/plotGeneCount.R
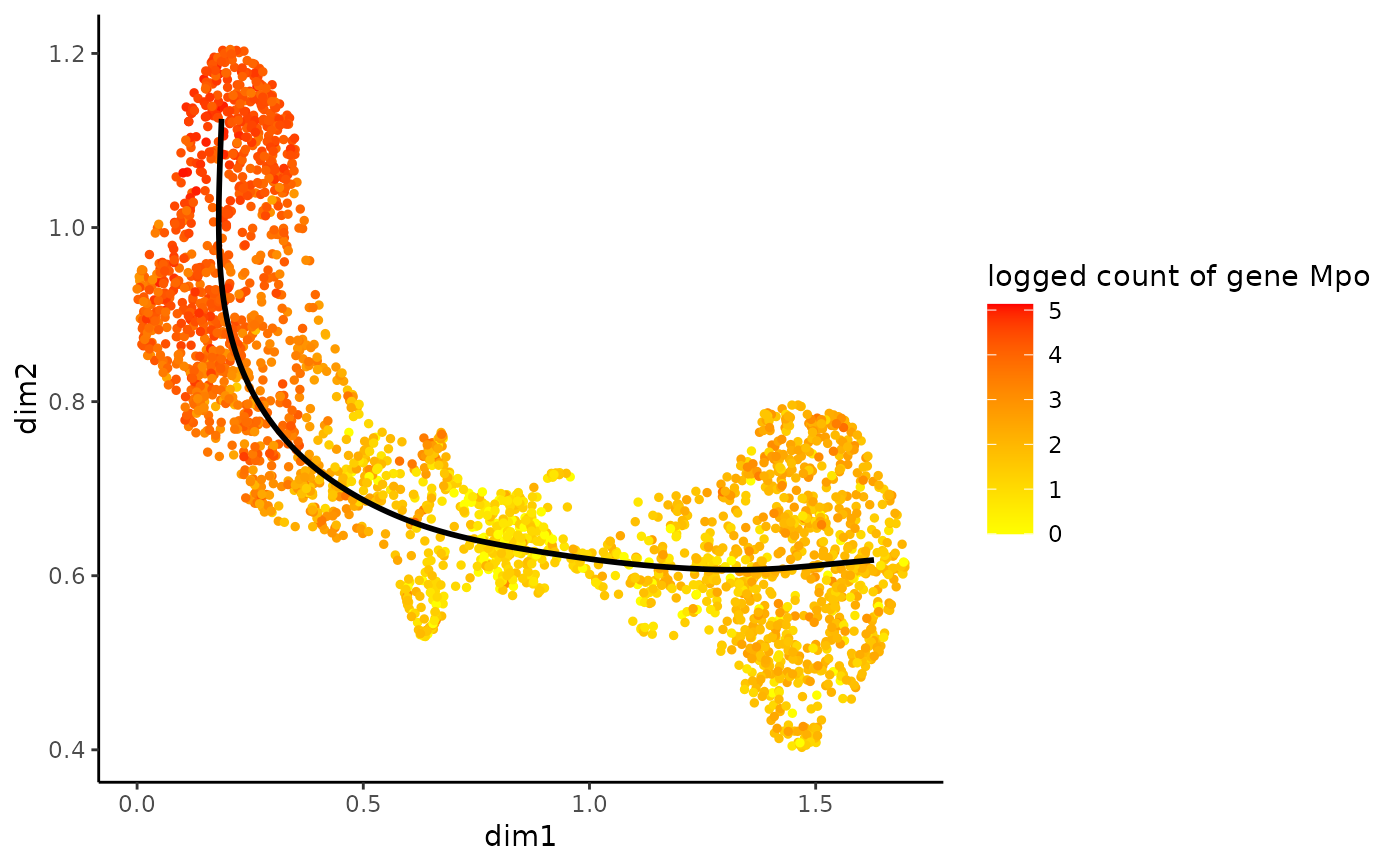
plotGeneCount.RdPlot the gene in reduced dimensional space.
plotGeneCount(curve, ...)

# S4 method for SlingshotDataSet
plotGeneCount(
  curve,
  counts = NULL,
  gene = NULL,
  clusters = NULL,
  models = NULL,
  title = NULL
)

# S4 method for SingleCellExperiment
plotGeneCount(
  curve,
  counts = NULL,
  gene = NULL,
  clusters = NULL,
  models = NULL,
  title = NULL
)

# S4 method for CellDataSet
plotGeneCount(
  curve,
  counts = NULL,
  gene = NULL,
  clusters = NULL,
  models = NULL,
  title = NULL
)
Arguments
| curve | One of three
|
|---|---|
| ... | parameters including: |
| counts | The count matrix, genes in rows and cells in columns. Only needed
if the input is of the type |
| gene | The name of gene for which you want to plot the count or the row
number of that gene in the count matrix. Alternatively, one can specify
the |
| clusters | The assignation of each cell to a cluster. Used to color the
plot. Either |
| models | The fitted GAMs, typically the output from
|
| title | Title for the plot. |
Value
A ggplot object
Details
If both gene and clusters arguments are supplied, the
plot will be colored according to gene count level. If none are provided, the
function will fail. When a CellDataset object is provided as input,
the function relies on the plot_cell_trajectory function
Examples
#>data(crv, package="tradeSeq") data(countMatrix, package="tradeSeq") rd <- slingshot::reducedDim(crv) cl <- kmeans(rd, centers = 7)$cluster lin <- slingshot::getLineages(rd, clusterLabels = cl, start.clus = 4)#>crv <- slingshot::getCurves(lin) counts <- as.matrix(countMatrix) gamList <- fitGAM(counts = counts, pseudotime = slingPseudotime(crv, na = FALSE), cellWeights = slingCurveWeights(crv)) plotGeneCount(crv, counts, gene = "Mpo")