Quality control for the target decoy approach for peptide identification
Lieven Clement
Ghent University1 load libraries
suppressPackageStartupMessages({
library(tidyverse)
library(TargetDecoy)
library(RCurl)
})
2 Download data from Zenodo
# Download data from zenodo
options(timeout=300)
url <- "https://zenodo.org/record/7308022/files/search-results.zip?download=1"
destFile <- "searchResults.zip"
if (!file.exists(destFile)) download.file(url, destFile)
unzip(destFile, exdir = "./data", overwrite = TRUE)
3 Pyrococcus
3.1 Import Pyrococcus Data in R
allTsvFiles <- list.files(
  path = "data",
  pattern = ".tsv$",
  full.names = TRUE)
msgfFiles <- allTsvFiles[grepl("msgf",allTsvFiles)&grepl("PXD001077",allTsvFiles)]
dfsmsgf <- lapply(msgfFiles, read_tsv)
## Rows: 136982 Columns: 34
## ── Column specification ────────────────────────────────────────────────────────
## Delimiter: "\t"
## chr (8): peptidoform, spectrum_id, run, protein_list, source, provenance:mz...
## dbl (22): score, precursor_mz, retention_time, rank, meta:calculatedMassToCh...
## lgl (4): collection, is_decoy, qvalue, pep
##
## ℹ Use `spec()` to retrieve the full column specification for this data.
## ℹ Specify the column types or set `show_col_types = FALSE` to quiet this message.
## Rows: 126277 Columns: 34
## ── Column specification ────────────────────────────────────────────────────────
## Delimiter: "\t"
## chr (8): peptidoform, spectrum_id, run, protein_list, source, provenance:mz...
## dbl (22): score, precursor_mz, retention_time, rank, meta:calculatedMassToCh...
## lgl (4): collection, is_decoy, qvalue, pep
##
## ℹ Use `spec()` to retrieve the full column specification for this data.
## ℹ Specify the column types or set `show_col_types = FALSE` to quiet this message.crapEntries <- scan("db-gpm-crap-entries.txt", what = "character")
dfsmsgf <- lapply(dfsmsgf, function(db)
db[rowSums(sapply(crapEntries, grepl,fixed=TRUE,x = db$protein_list)) == 0,])
tandemFiles <- allTsvFiles[grepl("xtandem",allTsvFiles)&grepl("PXD001077",allTsvFiles)]
dfsTandem <- lapply(tandemFiles, read_tsv)## Rows: 12586 Columns: 18
## ── Column specification ────────────────────────────────────────────────────────
## Delimiter: "\t"
## chr (5): peptidoform, spectrum_id, protein_list, source, provenance:xtandem_...
## dbl (7): score, precursor_mz, retention_time, provenance:xtandem_id, meta:xt...
## lgl (6): run, collection, is_decoy, qvalue, pep, rank
##
## ℹ Use `spec()` to retrieve the full column specification for this data.
## ℹ Specify the column types or set `show_col_types = FALSE` to quiet this message.
## Rows: 13949 Columns: 18
## ── Column specification ────────────────────────────────────────────────────────
## Delimiter: "\t"
## chr (5): peptidoform, spectrum_id, protein_list, source, provenance:xtandem_...
## dbl (7): score, precursor_mz, retention_time, provenance:xtandem_id, meta:xt...
## lgl (6): run, collection, is_decoy, qvalue, pep, rank
##
## ℹ Use `spec()` to retrieve the full column specification for this data.
## ℹ Specify the column types or set `show_col_types = FALSE` to quiet this message.dfsTandem <- lapply(dfsTandem, function(db)
db[rowSums(sapply(crapEntries, grepl,fixed=TRUE,x = db$protein_list)) == 0,])3.2 FDR function
Calculate FDR on tibble with search results. It is assumed that higher scores are better.
# FDR function
fdrDb <- function(db)
{
  db <- db %>%
    arrange(desc(score)) %>%
    mutate(FP = cumsum(is_decoy),
           FDR = cumsum(is_decoy)/cumsum(!is_decoy))
  FDR <- db$FDR
  FDRmin <- FDR[length(FDR)]
  for (j in (length(FDR)-1):1)
  {
    if (FDR[j] < FDRmin)
      FDRmin <- FDR[j] else
      FDR[j] <- FDRmin
  }
  db$FDR <- FDR
  db <- db %>%
    arrange(spectrum_id)
  return(db)
}
3.3 Generate plots for MSGF+
Histograms and P-P plots for rank1, rank 2 and search against human DB.
# Generate MSGF+ plots pyrococcus
histsMsgf <- lapply(
  dfsmsgf,
  function(db, score, decoy, log10)
    evalTargetDecoysHist(
      db %>% filter(rank==1),
      decoy,
      score,
      log10) +
    xlab("Score") +
    ggtitle(NULL) +
    geom_histogram(
      bins = 50,
      position = "identity",
      alpha = .9),
  score = "score",
  decoy = "is_decoy",
  log10 = TRUE)
histsMsgfR2 <- lapply(
  dfsmsgf,
  function(db, score, decoy, log10)
    evalTargetDecoysHist(db %>% filter(rank==2),
                         decoy,
                         score,
                         log10) +
    xlab("Score") +
    ggtitle(NULL) +
    geom_histogram(bins=50, position="identity",alpha=.9),
  score = "score",
  decoy = "is_decoy",
  log10 = TRUE)
ppPlotsMsgf <- lapply(dfsmsgf,
                      function(db, score, decoy, log10)
                        evalTargetDecoysPPPlot(db %>% filter(rank==1),
                                               decoy,
                                               score,
                                               log10) +
                        ggtitle(NULL) +
                        xlab("Fd") +
                        ylab("Ft"),
                      score = "score",
                      decoy = "is_decoy",
                      log10=TRUE)

pyroId <- which(
  grepl(
    pattern = "swissprot",
    msgfFiles,
    fixed = TRUE) &
    grepl(
      pattern = "pfuriosus",
      msgfFiles,
      fixed = TRUE)
  )

dfHlp <- dfsmsgf[[pyroId]]  %>%
  filter(rank==1) %>%
  mutate(score = -log10(score)) %>%
  fdrDb()
thresh <- dfHlp %>%
  filter(FDR < 0.01) %>%
  pull(score) %>%
  min
nSig <- dfHlp %>% filter(FDR < 0.01) %>% pull(is_decoy) %>% `!` %>% sum

humanId <- which(
  grepl(pattern="swissprot",msgfFiles,fixed = TRUE) & grepl(pattern="hsapiens",msgfFiles,fixed = TRUE)
  )

figMsgfSwissHistsPyroR1R2_Human <- gridExtra::grid.arrange(
      histsMsgf[[pyroId]] +
        geom_histogram(
          bins = 50,
          position = "identity",
          alpha = .9) +
         ggtitle(paste(nSig,"target PSMs at 1% FDR")) +
        annotate("rect",
                 xmin = thresh,
                 xmax = 35,
                 ymin = -10,
                 ymax = 1600,
                 alpha = .2) +
      annotate(geom = "text",
               x = thresh+1,
               y = 1500,
               label = "x > t['1% FDR']",
              color = "black",
              hjust = 0 ,
              parse = TRUE) +
        annotate(geom = "rect",
                 xmin = thresh,
                 xmax = thresh,
                 ymin = 0,
                 ymax = 1600,
                 color = "red") +
         theme(legend.position = c(0.75,0.75)),
    histsMsgfR2[[pyroId]] +
         geom_histogram(
           bins = 50,
           position = "identity",
           alpha = .9) +
         ggtitle("Rank 2 PSMs") +
         theme(legend.position = c(0.75,0.75)),
    histsMsgf[[humanId]] +
         geom_histogram(
           bins = 50,
           position = "identity",
           alpha = .9) +
         ggtitle("Spectra matched to H. sapiens") +
         theme(legend.position = c(0.75,0.75)),
    ncol=3)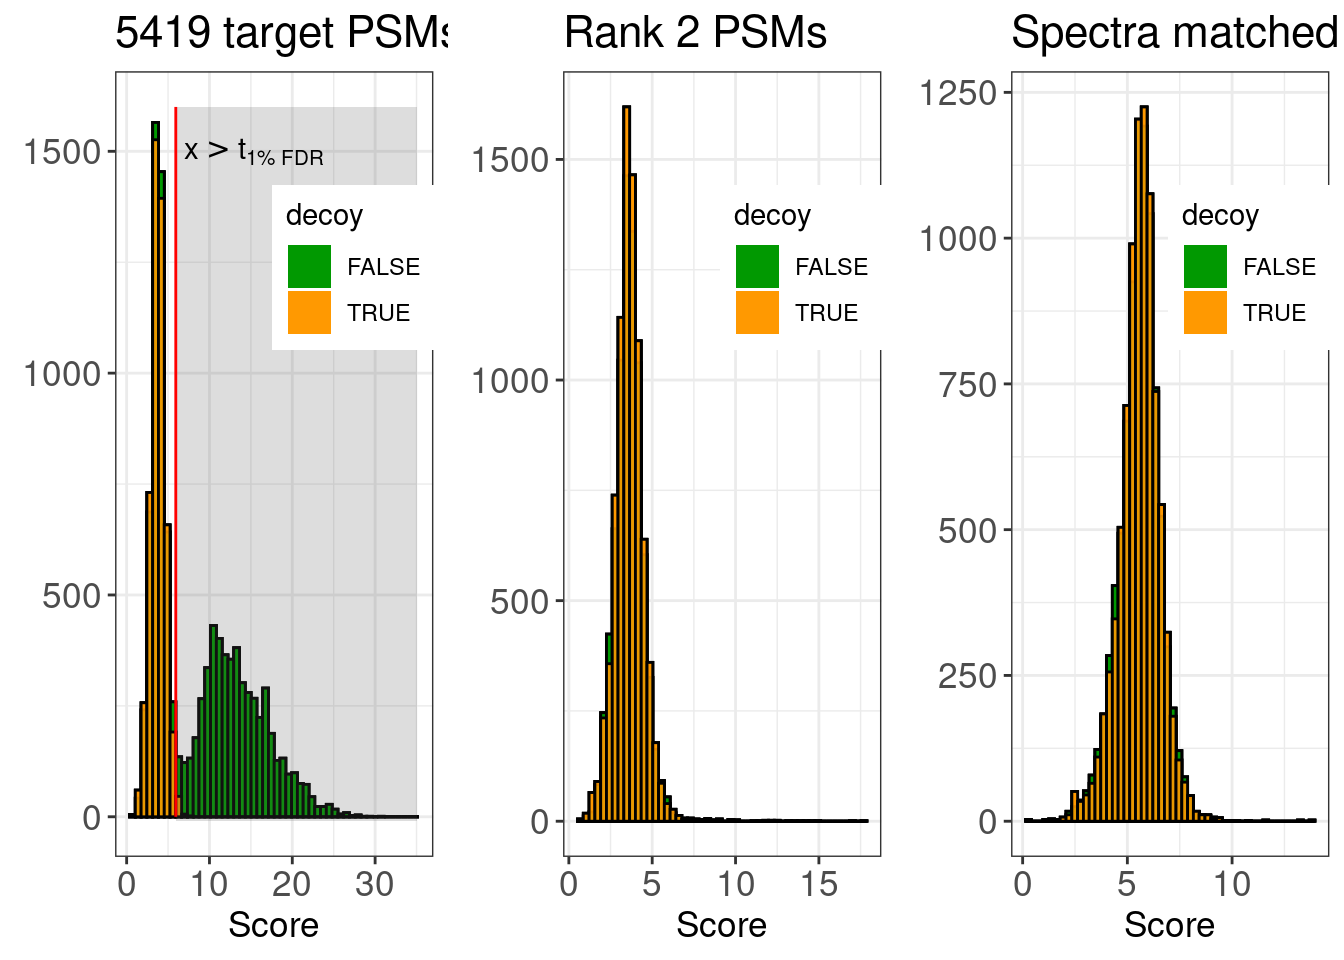
ggsave(
  "./figs/figMsgfSwissHistsPyroR1R2_Human.png",
  plot = figMsgfSwissHistsPyroR1R2_Human,
  device = "png",
  width = 11.7,
  height = 3.9)

ggsave(
  "./tiffs/figMsgfSwissHistsPyroR1R2_Human.tiff",
  plot = figMsgfSwissHistsPyroR1R2_Human,
  device = "tiff",
  width = 11.7,
  height = 3.9)
## Warning in grDevices::dev.off(): unable to open TIFF file './tiffs/
## figMsgfSwissHistsPyroR1R2_Human.tiff'figMsgfSwissPPplotsPyro_Human <-
gridExtra::grid.arrange(
ppPlotsMsgf[[humanId]] +
ggtitle(NULL),
ppPlotsMsgf[[pyroId]] +
ggtitle(NULL),
ncol=2)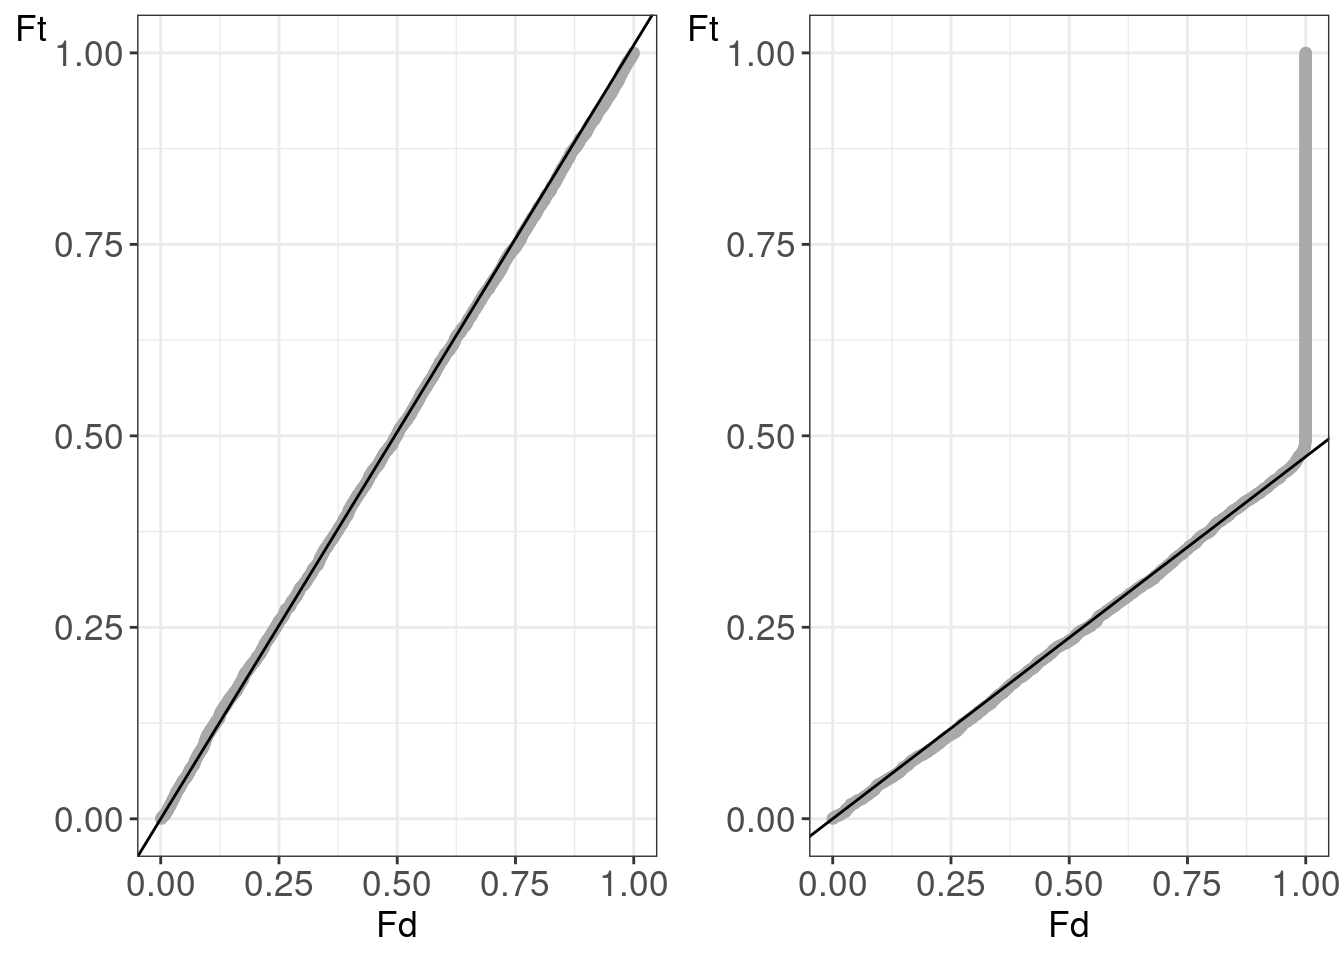
ggsave(
  "./figs/figMsgfSwissPPplotsPyro_Human.png",
  plot = figMsgfSwissPPplotsPyro_Human,
  device = "png",
  width = 7.8,
  height = 3.9)

ggsave(
  "./tiffs/figMsgfSwissPPplotsPyro_Human.tiff",
  plot = figMsgfSwissPPplotsPyro_Human,
  device = "tiff",
  width = 7.8,
  height = 3.9)
## Warning in grDevices::dev.off(): unable to open TIFF file './tiffs/
## figMsgfSwissPPplotsPyro_Human.tiff'3.4 X-tandem searches
3.4.1 Preprocess tandem data
Convert spectrum id into double for sorting + add FDR
# Preprocess Tandem pyrococcus results
for (i in 1:length(dfsTandem))
{

  dfsTandem[[i]] <- dfsTandem[[i]] %>%
    mutate(spectrum_id_orig = spectrum_id,
           spectrum_id = sapply(
             spectrum_id %>% strsplit(split=" "),
             function(x) substr(x[3],6,1000)) %>% as.double
    )
}
dfsTandem <- lapply(dfsTandem, fdrDb)
3.4.2 Plots for search with and without refinement.
# plots xtandem Results
histsTandem <- lapply(dfsTandem,
                      evalTargetDecoysHist,
                      score = "score",
                      decoy = "is_decoy",
                      log10 = FALSE)
ppPlotsTandem <- lapply(dfsTandem,
                        evalTargetDecoysPPPlot,
                        score = "score",
                        decoy = "is_decoy",
                        log10 = FALSE)

noRefineId <- which(grepl("no-refine",tandemFiles))
refineId <- which(!grepl("no-refine",tandemFiles))


figTandemRefineSwissHistPP <-
    gridExtra::grid.arrange(
       histsTandem[[refineId]] +
         geom_histogram(
           bins = 50,
           position = "identity",
           alpha=.9) +
         ylim(0, 1500) +
         xlim(-6.2, 35) +
         ggtitle(NULL) +
         theme(legend.position = c(0.75,0.75)),
       ppPlotsTandem[[refineId]] +
         ggtitle(NULL) +
         ylim(0,.6),
       ncol = 2)
## Warning: Removed 4 rows containing missing values (`geom_bar()`).
## Removed 4 rows containing missing values (`geom_bar()`).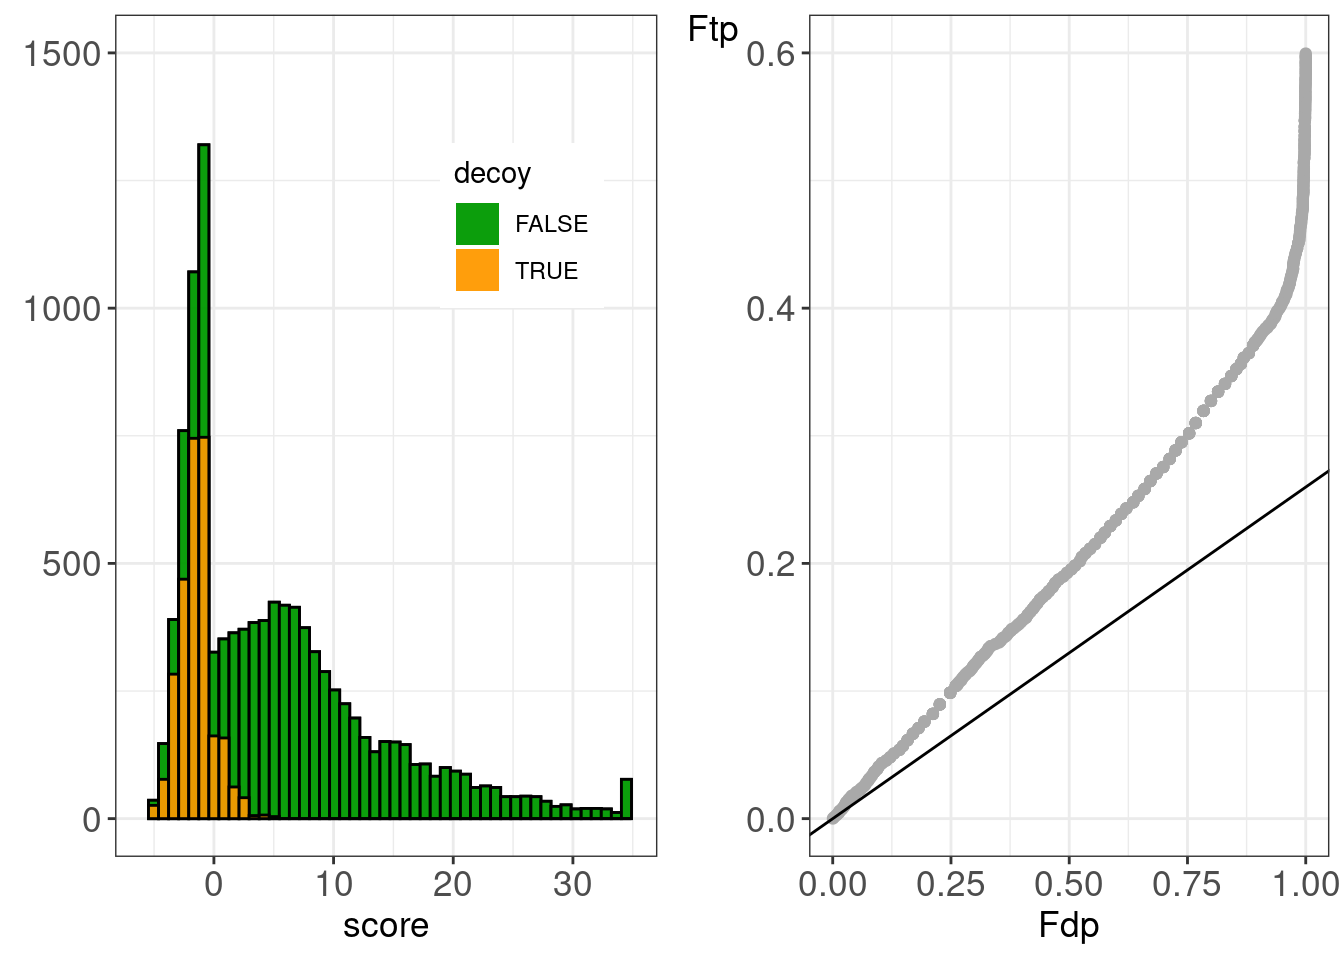
ggsave(
  "./figs/figTandemRefineSwissHistPP.png",
  plot =  figTandemRefineSwissHistPP,
  device = "png",
  width = 7.8,
  height = 3.9)

ggsave(
  "./tiffs/figTandemRefineSwissHistPP.tiff",
  plot =  figTandemRefineSwissHistPP,
  device = "tiff",
  width = 7.8,
  height = 3.9)
## Warning in grDevices::dev.off(): unable to open TIFF file './tiffs/
## figTandemRefineSwissHistPP.tiff'figTandemNoRefineSwissHistPP <-
gridExtra::grid.arrange(
histsTandem[[noRefineId]] +
geom_histogram(
bins = 50,
position = "identity",
alpha = .9) +
ylim(0, 1500) +
xlim(-6.2, 35) +
ggtitle(NULL) +
theme(legend.position = c(0.75,0.75)),
ppPlotsTandem[[noRefineId]] +
ggtitle(NULL) +
ylim(0,.6),
ncol=2)## Warning: Removed 4 rows containing missing values (`geom_bar()`).
## Removed 4 rows containing missing values (`geom_bar()`).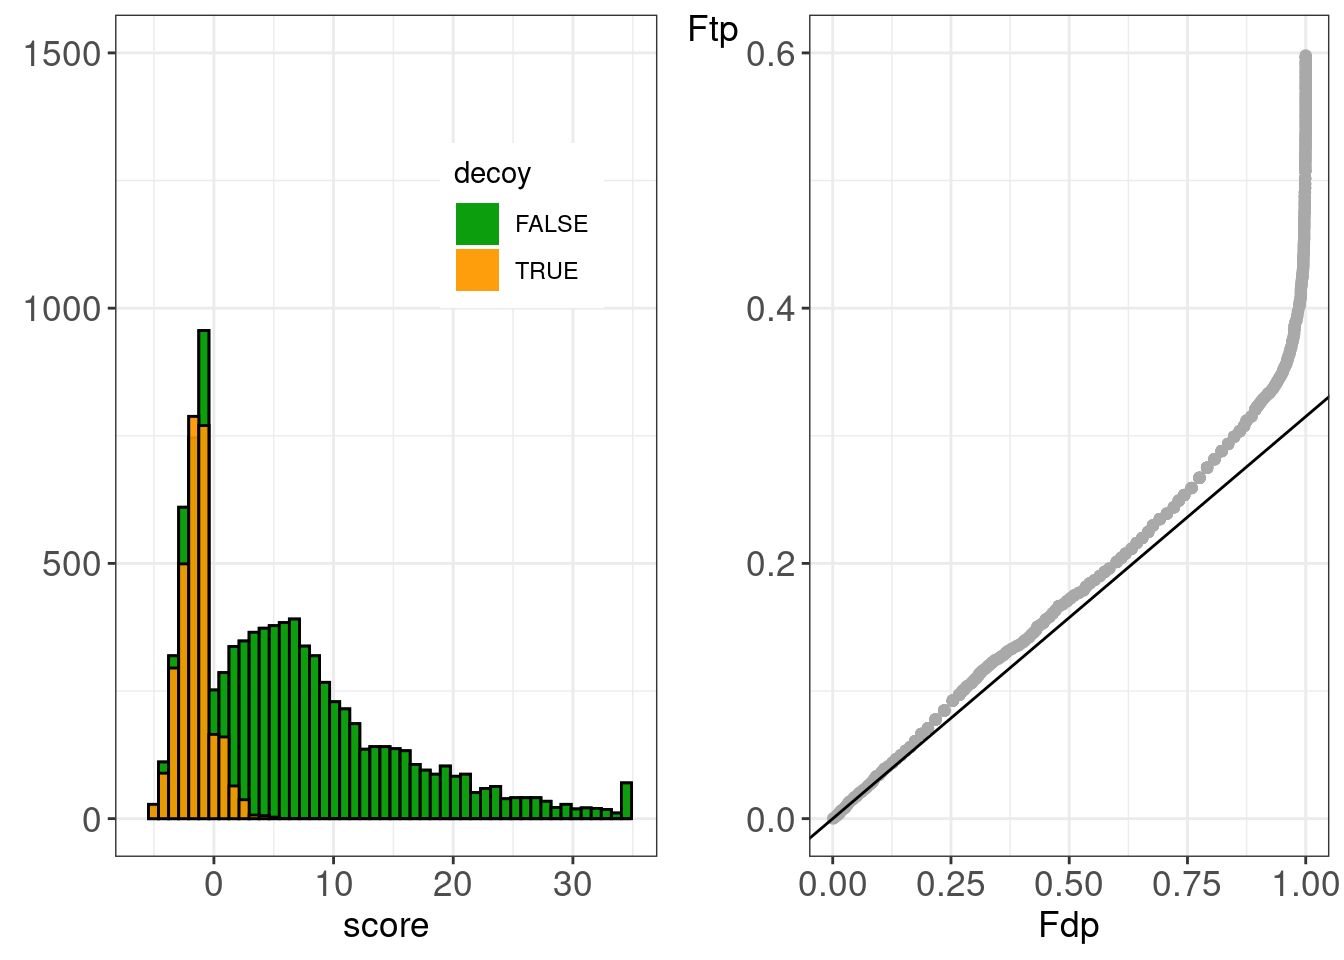
ggsave(
  "./figs/figTandemNoRefineSwissHistPP.png",
  plot = figTandemNoRefineSwissHistPP,
  device = "png",
  width = 7.8,
  height = 3.9)

ggsave(
  "./tiffs/figTandemNoRefineSwissHistPP.tiff",
  plot = figTandemNoRefineSwissHistPP,
  device = "tiff",
  width = 7.8,
  height = 3.9)
## Warning in grDevices::dev.off(): unable to open TIFF file './tiffs/
## figTandemNoRefineSwissHistPP.tiff'3.4.3 Plot to stratify refinement searched peptides
Calculate 1% FDR threshold for plot
thresh <- dfsTandem[[refineId]] %>%
  filter(FDR < 0.01) %>%
  pull(score) %>%
  min
Identify type of PSM: same match, swiched match or new spectrum upon refinement.
dfsTandem[[refineId]]$refine <- "switched"
dfsTandem[[refineId]]$inNoRefine <- dfsTandem[[refineId]]$spectrum_id %in%
  dfsTandem[[noRefineId]]$spectrum_id

dfsTandem[[refineId]]$refine[!dfsTandem[[refineId]]$inNoRefine] <- "new"

dfRefineCommon <- dfsTandem[[refineId]] %>%
  filter(inNoRefine)

dfsTandem[[noRefineId]]$inRefine <- dfsTandem[[noRefineId]]$spectrum_id %in%
  dfsTandem[[refineId]]$spectrum_id
dfNoRefineCommon <- dfsTandem[[noRefineId]] %>%
  filter(inRefine)
dfRefineCommon$refine[dfRefineCommon$peptidoform == dfNoRefineCommon$peptidoform] <-"same"

dfsTandem[[refineId]]$refine[dfsTandem[[refineId]]$inNoRefine] <- dfRefineCommon$refine
dfsTandem[[refineId]]$refineTD <- paste(
  dfsTandem[[refineId]]$refine,
  ifelse(
    dfsTandem[[refineId]]$is_decoy,
    "decoy",
    "target")
  ) %>%
  factor(levels = c("same target",
                    "same decoy",
                    "new target",
                    "switched target",
                    "new decoy",
                    "switched decoy")
         )
Construct figure with histograms stratefied according to PSM type.
figsTandemSwissRefinementHistPsmType <- dfsTandem[[refineId]] %>%
  ggplot(aes(x = score,
             fill = refineTD,
             col = I("black"))) +
  geom_histogram(bins = 50,
                 position = "identity",
                 alpha = .9) +
  scale_fill_manual(
    "values" = c(`same target` = "#009900",
                 `same decoy` = "#FF9900",
                 `new target` = "#5df542",
                 `new decoy`="#c03600",
                 `switched target`="#42f5c8",
                 `switched decoy` = "#f54281")
    ) +
  theme_bw() +
  theme(plot.title = element_text(size = rel(1.5)),
        axis.title = element_text(size = rel(1.2)),
        axis.text = element_text(size = rel(1.2)),
        axis.title.y = element_text(angle = 0))

psmType <- dfsTandem[[refineId]] %>%
  pull(refineTD) %>%
  table
pi0 <- sum(dfsTandem[[refineId]]$is_decoy)/ sum(!dfsTandem[[refineId]]$is_decoy)
piSame <- psmType["same decoy"]/sum(!dfsTandem[[refineId]]$is_decoy)
piSameNew <- (psmType["same decoy"]+psmType["new decoy"])/sum(!dfsTandem[[refineId]]$is_decoy)
piSameNewSwitch <- (psmType["same decoy"]+psmType["new decoy"] + psmType["switched decoy"])/sum(!dfsTandem[[refineId]]$is_decoy)
piSameNewSwitchNewTarget <- (psmType["same decoy"]+psmType["new decoy"] + psmType["switched decoy"] + psmType["new target"])/sum(!dfsTandem[[refineId]]$is_decoy)


figTandemRefineSwissPSMtypeHistPP <-
    gridExtra::grid.arrange(
         figsTandemSwissRefinementHistPsmType +
           ggtitle(NULL) +
           ylab(NULL) +
           xlim(-6.2, 35) +
           theme(
             legend.position = c(0.73,0.68),
             legend.title = element_blank()) +
           annotate("rect",
                    xmin = thresh,
                    xmax = 35,
                    ymin = -10,
                    ymax = 1500,
                    alpha = .2) +
      annotate(geom = "text",
               x = thresh+1,
               y = 1400,
               label = "x > t['1% FDR']",
               color = "black",
               hjust = 0 ,
               parse = TRUE) +
        annotate(geom = "rect",
                 xmin = thresh,
                 xmax = thresh,
                 ymin = 0,
                 ymax = 1500,
                 color = "red"),
         ppPlotsTandem[[refineId]] +
           geom_polygon(
             aes(x = x, y = y),
             data = data.frame(
               x = c(0, 1, 1),
               y = c(0, 0, piSame)),
             fill = "#FF9900",
             inherit.aes = FALSE) +
           geom_polygon(
             aes(x = x,y = y),
             data = data.frame(
               x = c(0, 1, 1),
               y = c(0, piSame, piSameNew)),
             fill = "#c03600",
             inherit.aes = FALSE) +
           geom_polygon(
             aes(x = x,y = y),
             data = data.frame(
               x = c(0, 1, 1),
               y = c(0, piSameNew, piSameNewSwitch)),
             fill = "#f54281",
             inherit.aes = FALSE) +
           geom_polygon(
             aes(x = x,y = y),
             data = data.frame(
               x = c(0, 1, 1),
               y = c(0, piSameNewSwitch, piSameNewSwitchNewTarget)),
             fill = "#5df542",
             inherit.aes = FALSE) +
           geom_abline(slope = pi0) +
           geom_abline(slope = piSameNewSwitchNewTarget) +
           ylim(0, 0.6) +
           ggtitle(NULL),
      ncol = 2)
## Warning: Removed 12 rows containing missing values (`geom_bar()`).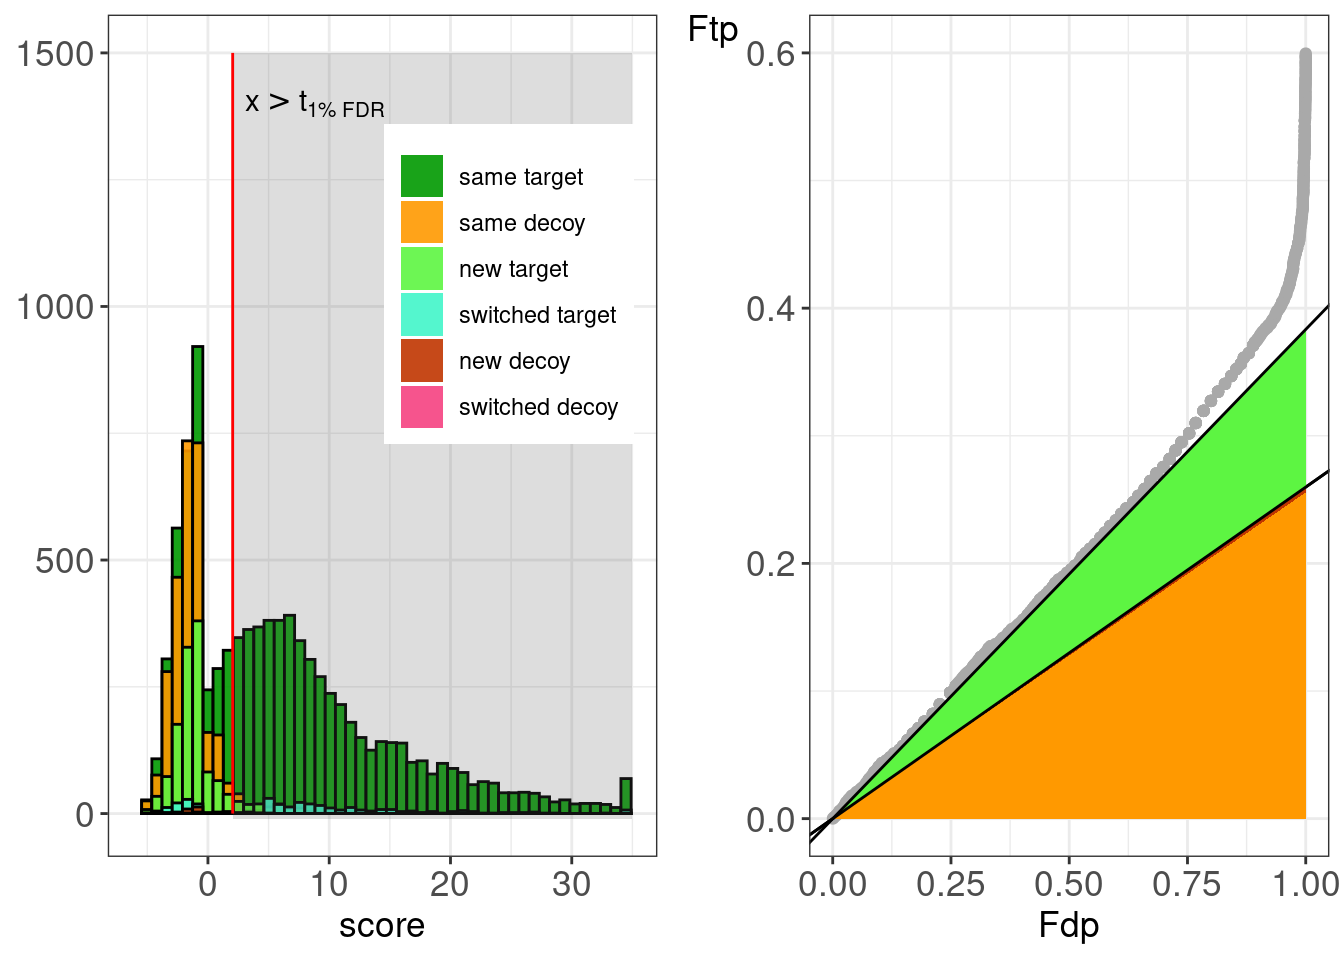
ggsave("./figs/figTandemRefineSwissPSMtypeHistPP.png",
       plot = figTandemRefineSwissPSMtypeHistPP,
       device = "png",
       width = 7.8,
       height = 3.9)

ggsave("./tiffs/figTandemRefineSwissPSMtypeHistPP.tiff",
       plot = figTandemRefineSwissPSMtypeHistPP,
       device = "tiff",
       width = 7.8,
       height = 3.9)
## Warning in grDevices::dev.off(): unable to open TIFF file './tiffs/
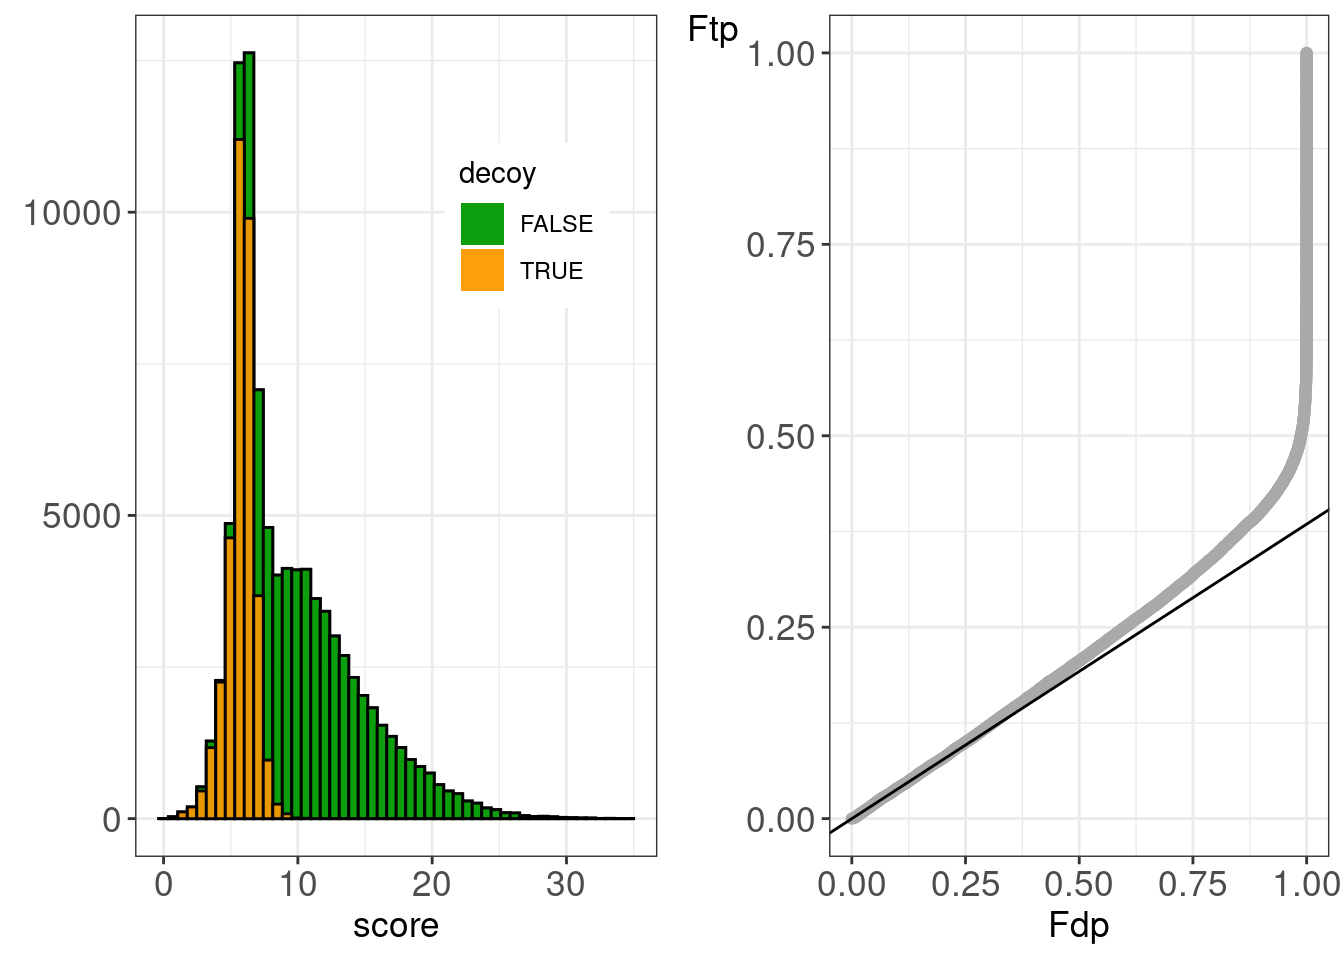
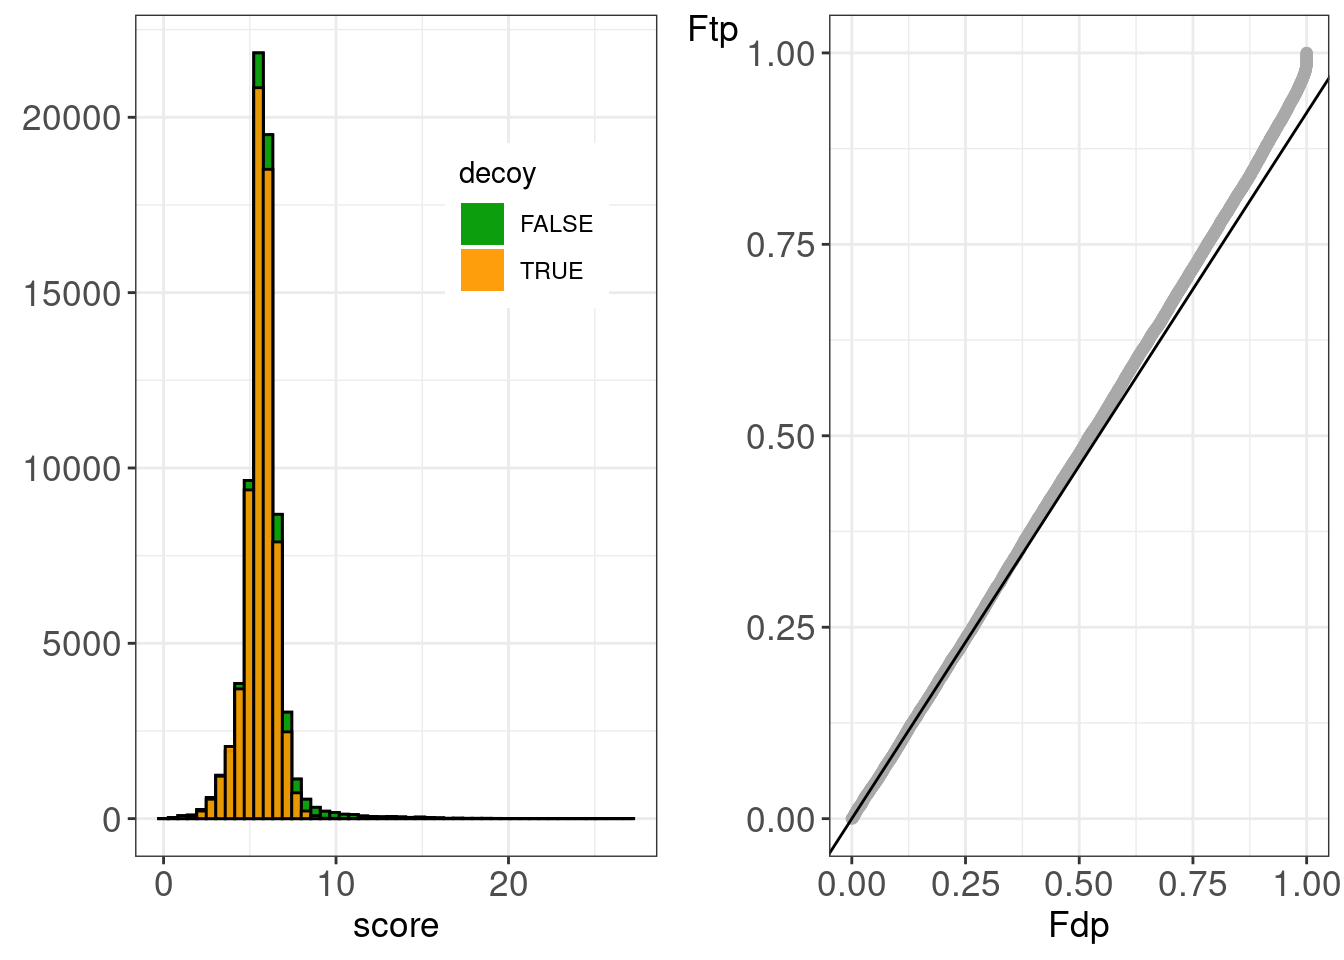
## figTandemRefineSwissPSMtypeHistPP.tiff'4 Human sample
Make diagnostic plots for rank 1 and rank 2.
# P-P plot for human sample
path2File <- "./data/PXD028735-LFQ_Orbitrap_DDA_Human_01_uniprot-hsapiens-canonical-isoforms-crap_msgfplus-phospho.msgf.mzid.tsv"
df <- read_tsv(path2File)
## Rows: 1058347 Columns: 21
## ── Column specification ────────────────────────────────────────────────────────
## Delimiter: "\t"
## chr (8): peptidoform, spectrum_id, run, protein_list, source, provenance:mzi...
## dbl (9): score, precursor_mz, retention_time, rank, meta:calculatedMassToCha...
## lgl (4): collection, is_decoy, qvalue, pep
##
## ℹ Use `spec()` to retrieve the full column specification for this data.
## ℹ Specify the column types or set `show_col_types = FALSE` to quiet this message.df <- df[
rowSums(
sapply(crapEntries,
grepl,
fixed = TRUE,
x = df$protein_list)
) == 0,]
figHumanMsgfPlus <- gridExtra::grid.arrange(
evalTargetDecoysHist(
df %>% filter(rank==1),
"is_decoy",
"score",
TRUE) +
ggtitle(NULL) +
geom_histogram(bins = 50,
alpha = .9,
position = "identity") +
theme(
legend.position = c(0.75,0.75),
),
evalTargetDecoysPPPlot(
df %>% filter(rank==1),
"is_decoy",
"score",
TRUE) +
ggtitle(NULL),
ncol = 2
)
ggsave(
  filename = "./figs/figHumanMsgfPlus.png",
  plot = figHumanMsgfPlus,
  device = "png",
  width = 7.8,
  height = 3.9)

ggsave(
  filename = "./tiffs/figHumanMsgfPlus.tiff",
  plot = figHumanMsgfPlus,
  device = "tiff",
  width = 7.8,
  height = 3.9)
## Warning in grDevices::dev.off(): unable to open TIFF file './tiffs/
## figHumanMsgfPlus.tiff'figHumanMsgfPlusR2 <-
gridExtra::grid.arrange(
evalTargetDecoysHist(
df %>% filter(rank==2),
"is_decoy",
"score",
TRUE) +
ggtitle(NULL) +
geom_histogram(bins = 50,
alpha = .9,
position = "identity") +
theme(legend.position = c(0.75,0.75)),
evalTargetDecoysPPPlot(df %>% filter(rank==2),
"is_decoy",
"score",
TRUE) +
ggtitle(NULL),
ncol = 2
)
ggsave(
  filename = "./figs/figHumanMsgfPlusR2.png",
  plot = figHumanMsgfPlusR2,
  device = "png",
  width = 7.8,
  height = 3.9)

ggsave(
  filename = "./tiffs/figHumanMsgfPlusR2.tiff",
  plot = figHumanMsgfPlusR2,
  device = "tiff",
  width = 7.8,
  height = 3.9)
## Warning in grDevices::dev.off(): unable to open TIFF file './tiffs/
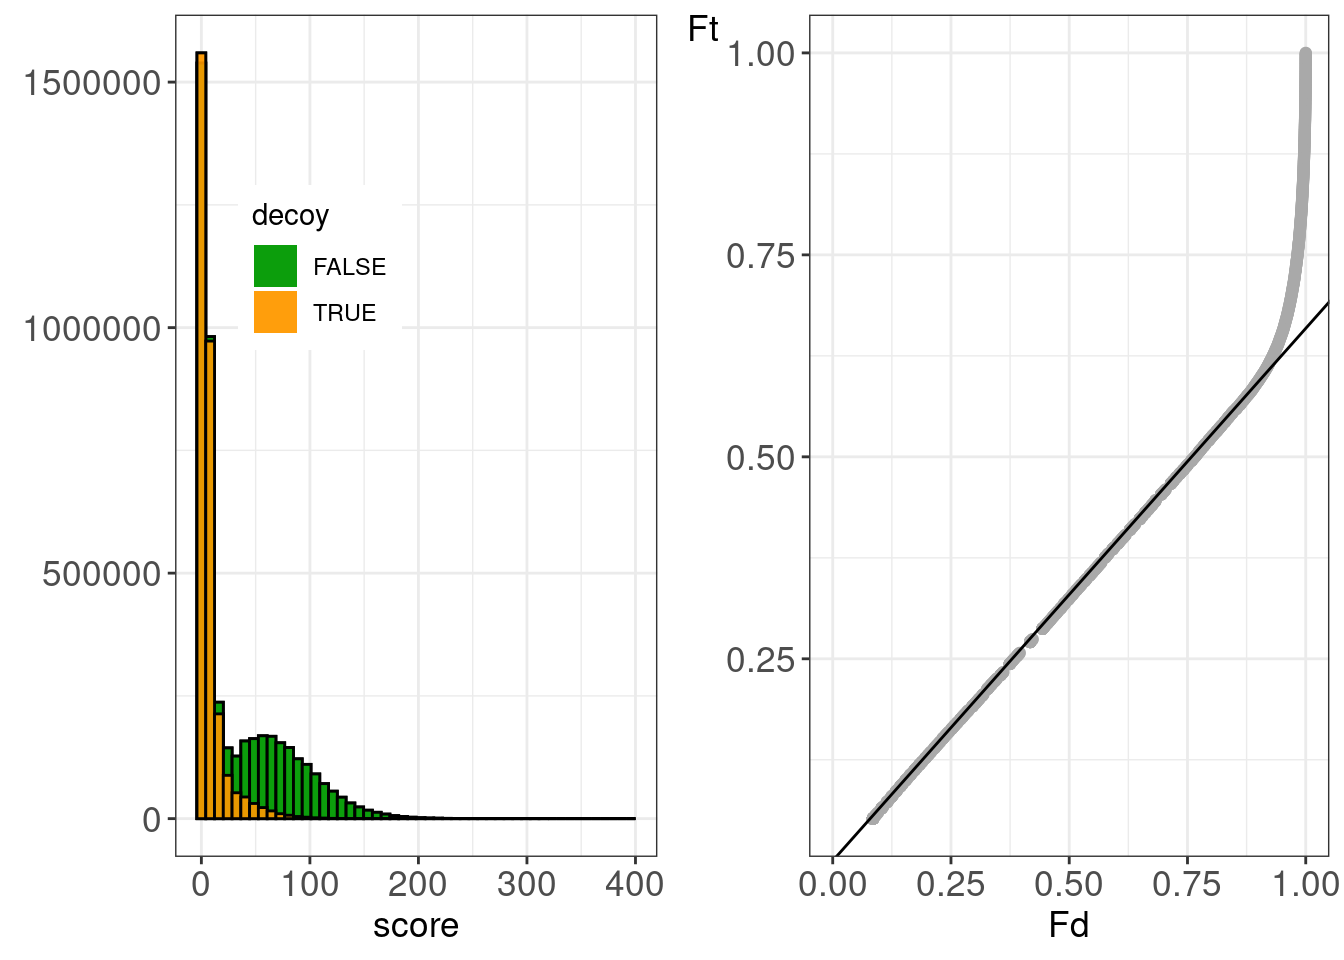
## figHumanMsgfPlusR2.tiff'5 Immunopeptidomics
Make diagnostic plots
# plot immunopeptidomics plot
path2File <- "./data/immunopeptidomics_msms_IAA.txt"
df <- read_tsv(path2File)
## Rows: 7622632 Columns: 22
## ── Column specification ────────────────────────────────────────────────────────
## Delimiter: "\t"
## chr (8): peptide, run, protein_list, source, provenance:msms_filename, meta...
## dbl (10): spectrum_id, score, precursor_mz, retention_time, meta:Delta Score...
## lgl (4): collection, is_decoy, qvalue, pep
##
## ℹ Use `spec()` to retrieve the full column specification for this data.
## ℹ Specify the column types or set `show_col_types = FALSE` to quiet this message.figPeptidomics <-
gridExtra::grid.arrange(
evalTargetDecoysHist(df,
"is_decoy",
"score",
FALSE) +
geom_histogram(bins = 50,
alpha = .9,
position = "identity") +
ggtitle(NULL) +
theme(legend.position = c(0.3,0.7)),
evalTargetDecoysPPPlot(df,
"is_decoy",
"score",
FALSE) +
xlab("Fd") +
ylab("Ft") +
ggtitle(NULL),
ncol = 2
)
ggsave(
  filename = "./figs/figPeptidomics.png",
  plot = figPeptidomics,
  device = "png",
  width = 7.8,
  height = 3.9)

ggsave(
  filename = "./tiffs/figPeptidomics.tiff",
  plot = figPeptidomics,
  device = "tiff",
  width = 7.8,
  height = 3.9)
## Warning in grDevices::dev.off(): unable to open TIFF file './tiffs/
## figPeptidomics.tiff'6 Joint P-Plot
Put searches of MSGF+ and XTandem with refinement on one plot.
# Joint PP-plot
msgfId <- which(
  grepl(
    pattern = "swissprot",
    msgfFiles,
    fixed = TRUE) &
    grepl(pattern = "pfuriosus",
          msgfFiles,
          fixed = TRUE)
  )

h <- TargetDecoy:::processObjects(
  list(dfsTandem[[refineId]],
       dfsmsgf[[msgfId]] %>% filter(rank==1)),
  decoy = c("is_decoy", "is_decoy"),
  score = c("score", "score"),
  log10=c(FALSE, TRUE)
  ) %>%
  TargetDecoy:::ppScoresData()

jointPlot <-  h$df %>%
    ggplot(aes(Fdp, z, color = id %>% as.factor)) +
    geom_point() +
    geom_abline(slope = 0) +
    theme_bw() +
    theme(legend.title = element_blank(),
          legend.position = c(0.2,.85)) +
    ylab("Ft-pi0") +
    scale_color_discrete(labels=c("X!Tandem","MSGF+")) +
    xlab("Fd")

jointPlot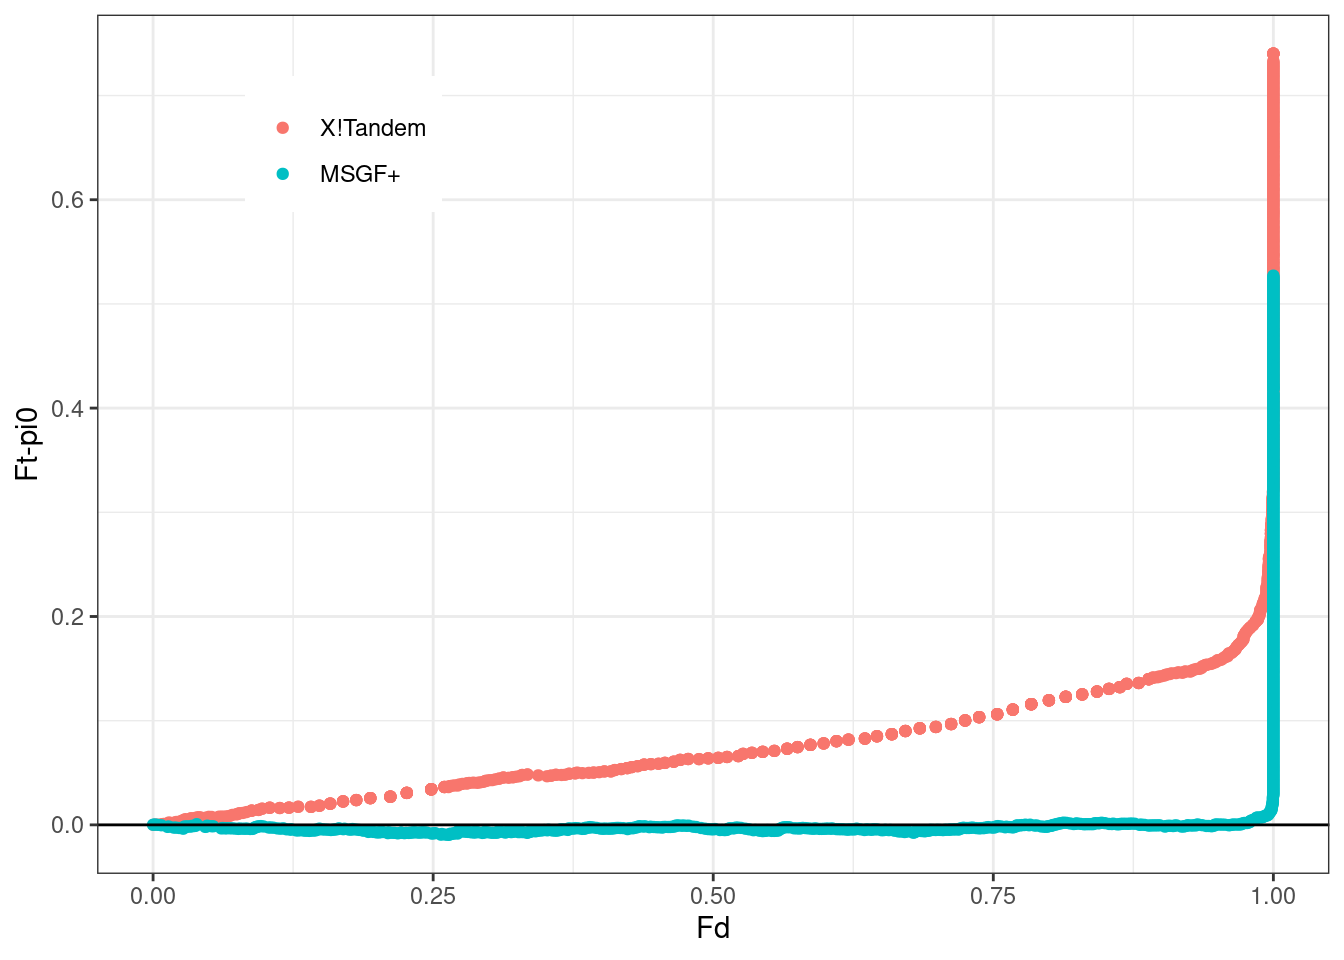
ggsave(
  file = "./figs/figTandemMsGfSwissCombindedPP.png",
  plot = jointPlot,
  device = "png",
  width = 3.9,
  height = 3.9)

ggsave(
  file = "./tiffs/figTandemMsGfSwissCombindedPP.tiff",
  plot = jointPlot,
  device = "tiff",
  width = 3.9,
  height = 3.9)
## Warning in grDevices::dev.off(): unable to open TIFF file './tiffs/
## figTandemMsGfSwissCombindedPP.tiff'7 Graphical abstract
histsTandem25 <- lapply(dfsTandem,
                        evalTargetDecoysHist,
                        score="score",
                        decoy="is_decoy",
                        log10 = FALSE,
                        nBins = 25)

histsMsgf25 <- lapply(dfsmsgf,
                      function(db, score, decoy, log10)
                        evalTargetDecoysHist(
                          db %>% filter(rank==1),
                          decoy,
                          score,
                          log10) +
                        xlab("Score") +
                        ggtitle(NULL) +
                        geom_histogram(bins = 25,
                                       position = "identity",
                                       alpha = .9),
                      score = "score",
                      decoy = "is_decoy",
                      log10 = TRUE)

  set.seed(15123)
  df <- data.frame(
    xtheo = c(
      sample(
        seq(0.5, 2.1, length = 30), 10),
      rep(NA,5)
      ),
    y0 = rep(0.8, 15),
    ytheo =rep(2.2, 15)
    ) %>%
  mutate(
      xreal = c(sample(xtheo,8),
                sample(seq(0.7, 2.1, length = 20),
                       7)
                ),
      yreal = c(runif(15, .1, 1.5))
  )
theoPlot <- df %>%
  ggplot() +
  annotate("rect",
           xmin = 0,
           xmax = 2,
           ymin = 1,
           ymax = 3,
           col = "black",
           fill = "white") +
  annotate("rect",
           xmin = 0.2,
           xmax = 2.2,
           ymin = .8,
           ymax = 2.8,
           col = "black",
           fill = "white") +
    annotate("rect",
             xmin = 0.4,
             xmax = 2.4,
             ymin = .6,
             ymax = 2.6,
             col = "black",
             fill = "white") +
     annotate("rect",
              xmin = 0,
              xmax = 2.0,
              ymin = -1.6,
              ymax = 0.4,
              col = "black",
              fill = "white") +
   annotate("rect",
            xmin = 0.2,
            xmax = 2.2,
            ymin = -1.8,
            ymax = 0.2,
            col = "black",
            fill = "white") +
   annotate("rect",
            xmin = 0.4,
            xmax = 2.4,
            ymin = -2,
            ymax = 0,
            col = "black",
            fill = "white") +
  geom_segment(aes(x = xtheo,
                   xend = xtheo,
                   y = y0,
                   yend = ytheo)) +
  annotate("text",
           x = 1,
           y=3.2,
           label="Database") +
  annotate("text",
           x = 1.4,
           y=-2.2,
           label = "MS2 spectra") +
  geom_segment(aes(
    x = xreal,
    xend = xreal,
    y = y0-2.6,
    yend = yreal-1.8)) +
  theme(axis.line = element_blank(),
        axis.text.x = element_blank(),
        axis.text.y = element_blank(),
        axis.ticks = element_blank(),
        axis.title.x = element_blank(),
        axis.title.y = element_blank(),
        legend.position = "none",
        panel.background = element_blank(),
        panel.border = element_blank(),
        panel.grid.major = element_blank(),
        panel.grid.minor = element_blank(),
        plot.background = element_blank()) +
    annotate("segment",
             x = 2.8,
             xend = 3.8,
             y = 0.3,
             yend = 0.3,
             arrow = arrow()) +
    annotate("text",
             x = 3.3,
             y = 1.3,
             label = "Search\n Engine") +
    annotate("text",
             x = 3.3,
             y = -.5,
             label = "TDA")

tocPlot <- gridExtra::grid.arrange(
    theoPlot,
    histsMsgf25[[pyroId]] +
        geom_histogram(
          bins = 25,
          position = "identity",
          alpha = .9) +
        ggtitle("Valid TDA") +
        theme(
            legend.position = "none",
            plot.title = element_text(hjust = 0.5),
            panel.grid.major = element_blank(),
            panel.grid.minor = element_blank()
            ),
    ppPlotsMsgf[[pyroId]] +
        ggtitle(NULL) +
        xlab("Fd") +
        ylab("Ft") +
        ylim(0, .6) +
        scale_x_continuous(breaks = c(0, 0.5, 1.0)) +
        theme(
            panel.grid.major = element_blank(),
            panel.grid.minor = element_blank()
            ),
    histsTandem25[[refineId]] +
         geom_histogram(bins = 25,
                        position = "identity",
                        alpha = .9) +
        scale_fill_manual(
            values = c(`FALSE` = "#009900",
                       `TRUE` = "#FF9900"),
            labels=c("Target", "Decoy")) +
        xlim(-6.2,35) +
        ggtitle("Invalid TDA") +
        theme(
            legend.position = c(0.75,0.6),
            legend.title = element_blank(),
            plot.title = element_text(hjust = 0.5),
            panel.grid.major = element_blank(),
            panel.grid.minor = element_blank()),
    ppPlotsTandem[[refineId]] +
        ggtitle(NULL) +
        ylim(0, .6) +
        xlab("Fd") +
        ylab("Ft") +
        scale_x_continuous(breaks = c(0, 0.5, 1.0)) +
        theme(panel.grid.major = element_blank(),
              panel.grid.minor = element_blank()),
    nrow = 2,
    ncol = 3,
    layout_matrix = rbind(c(1, 2, 4),
                          c(1, 3, 5))
    )
## Scale for fill is already present.
## Adding another scale for fill, which will replace the existing scale.## Warning: Removed 5 rows containing missing values (`geom_segment()`).## Warning: Removed 4 rows containing missing values (`geom_segment()`).## Warning: Removed 4 rows containing missing values (`geom_bar()`).
## Removed 4 rows containing missing values (`geom_bar()`).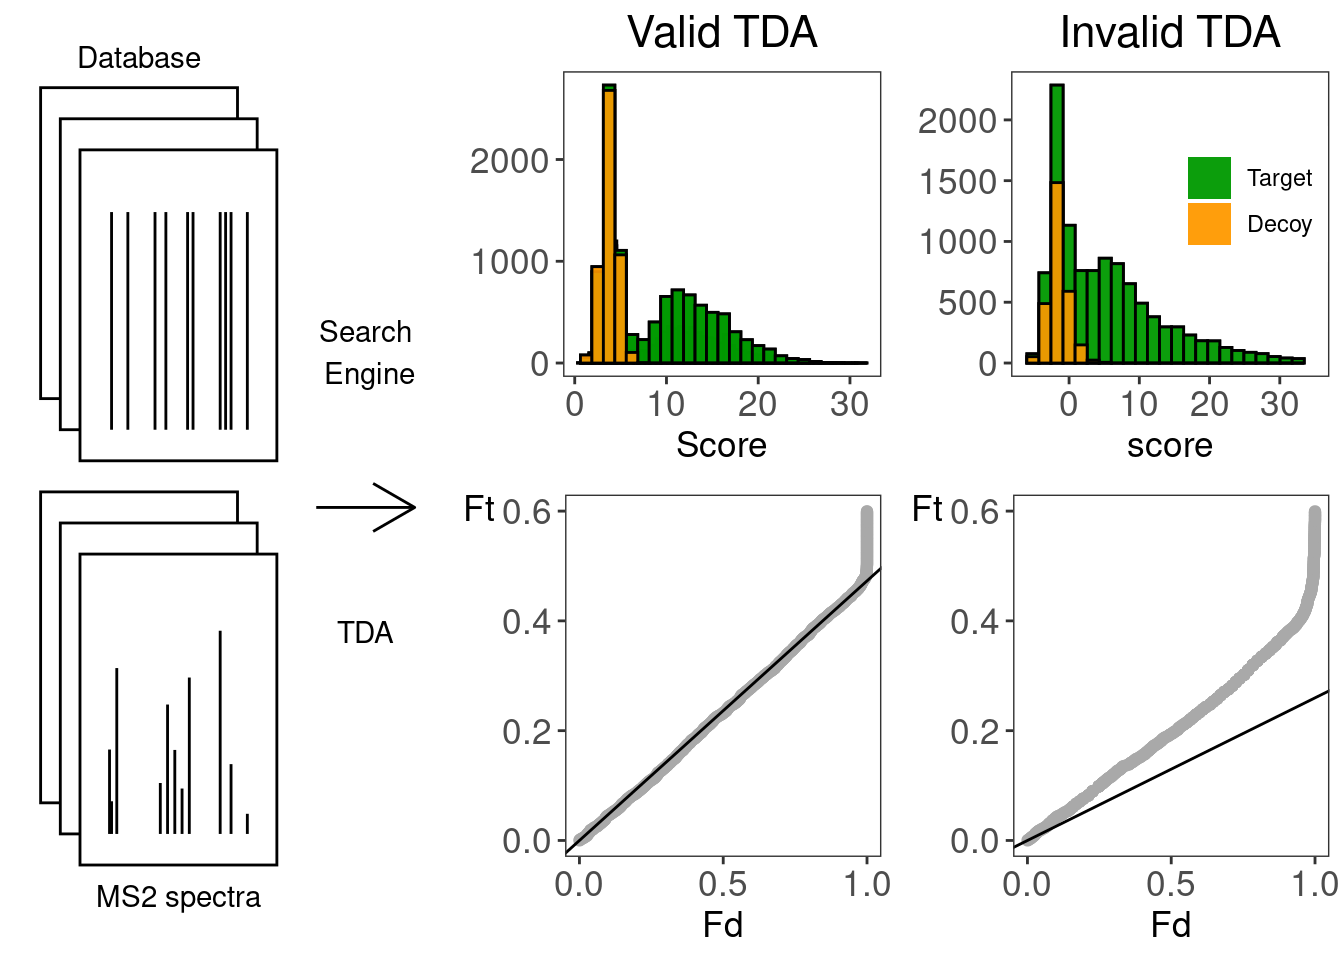
tocPlot## TableGrob (2 x 3) "arrange": 5 grobs
## z cells name grob
## 1 1 (1-2,1-1) arrange gtable[layout]
## 2 2 (1-1,2-2) arrange gtable[layout]
## 3 3 (2-2,2-2) arrange gtable[layout]
## 4 4 (1-1,3-3) arrange gtable[layout]
## 5 5 (2-2,3-3) arrange gtable[layout]ggsave("./figs/figGraphicalAbstract.png",
device = "png",
plot = tocPlot,
width = 7,
height = 3.9)
ggsave("./tiffs/figGraphicalAbstract.tiff",
device ="tiff",
plot = tocPlot,
width = 7,
height = 3.9)## Warning in grDevices::dev.off(): unable to open TIFF file './tiffs/
## figGraphicalAbstract.tiff'8 Clean up files
f <- list.files("./data", recursive = TRUE, full.names = TRUE)
file.remove(f)
## [1] TRUE TRUE TRUE TRUE TRUE TRUE TRUE TRUE TRUE TRUE TRUEfile.remove("data")## [1] TRUEfile.remove(destFile)## [1] TRUE9 Session Info
sessionInfo()## R version 4.2.2 (2022-10-31)
## Platform: x86_64-pc-linux-gnu (64-bit)
## Running under: Ubuntu 20.04.5 LTS
##
## Matrix products: default
## BLAS: /usr/lib/x86_64-linux-gnu/blas/libblas.so.3.9.0
## LAPACK: /usr/lib/x86_64-linux-gnu/lapack/liblapack.so.3.9.0
##
## locale:
## [1] LC_CTYPE=C.UTF-8 LC_NUMERIC=C LC_TIME=C.UTF-8
## [4] LC_COLLATE=C.UTF-8 LC_MONETARY=C.UTF-8 LC_MESSAGES=C.UTF-8
## [7] LC_PAPER=C.UTF-8 LC_NAME=C LC_ADDRESS=C
## [10] LC_TELEPHONE=C LC_MEASUREMENT=C.UTF-8 LC_IDENTIFICATION=C
##
## attached base packages:
## [1] stats graphics grDevices datasets utils methods base
##
## other attached packages:
## [1] RCurl_1.98-1.9 TargetDecoy_1.4.0 forcats_0.5.2 stringr_1.4.1
## [5] dplyr_1.0.10 purrr_0.3.5 readr_2.1.3 tidyr_1.2.1
## [9] tibble_3.1.8 ggplot2_3.4.0 tidyverse_1.3.2
##
## loaded via a namespace (and not attached):
## [1] bitops_1.0-7 ProtGenerics_1.30.0 fs_1.5.2
## [4] bit64_4.0.5 lubridate_1.9.0 doParallel_1.0.17
## [7] httr_1.4.4 tools_4.2.2 backports_1.4.1
## [10] bslib_0.4.1 utf8_1.2.2 R6_2.5.1
## [13] DBI_1.1.3 BiocGenerics_0.44.0 colorspace_2.0-3
## [16] withr_2.5.0 gridExtra_2.3 tidyselect_1.2.0
## [19] bit_4.0.4 compiler_4.2.2 cli_3.4.1
## [22] rvest_1.0.3 Biobase_2.58.0 xml2_1.3.3
## [25] labeling_0.4.2 sass_0.4.2 scales_1.2.1
## [28] digest_0.6.30 rmarkdown_2.18 pkgconfig_2.0.3
## [31] htmltools_0.5.3 highr_0.9 dbplyr_2.2.1
## [34] fastmap_1.1.0 rlang_1.0.6 readxl_1.4.1
## [37] shiny_1.7.3 farver_2.1.1 jquerylib_0.1.4
## [40] generics_0.1.3 jsonlite_1.8.3 vroom_1.6.0
## [43] mzID_1.36.0 googlesheets4_1.0.1 magrittr_2.0.3
## [46] Rcpp_1.0.9 munsell_0.5.0 fansi_1.0.3
## [49] lifecycle_1.0.3 stringi_1.7.8 yaml_2.3.6
## [52] plyr_1.8.7 grid_4.2.2 parallel_4.2.2
## [55] promises_1.2.0.1 crayon_1.5.2 miniUI_0.1.1.1
## [58] haven_2.5.1 hms_1.1.2 mzR_2.32.0
## [61] knitr_1.40 pillar_1.8.1 codetools_0.2-18
## [64] reprex_2.0.2 XML_3.99-0.12 glue_1.6.2
## [67] evaluate_0.18 renv_0.16.0 modelr_0.1.10
## [70] vctrs_0.5.0 tzdb_0.3.0 httpuv_1.6.6
## [73] foreach_1.5.2 cellranger_1.1.0 gtable_0.3.1
## [76] assertthat_0.2.1 cachem_1.0.6 xfun_0.34
## [79] mime_0.12 xtable_1.8-4 broom_1.0.1
## [82] later_1.3.0 ncdf4_1.19 googledrive_2.0.0
## [85] gargle_1.2.1 iterators_1.0.14 timechange_0.1.1
## [88] ellipsis_0.3.2LS0tCnRpdGxlOiAiUXVhbGl0eSBjb250cm9sIGZvciB0aGUgdGFyZ2V0IGRlY295IGFwcHJvYWNoIGZvciBwZXB0aWRlIGlkZW50aWZpY2F0aW9uIgphdXRob3I6IAogIC0gbmFtZTogTGlldmVuIENsZW1lbnQKICAgIGFmZmlsaWF0aW9uOgogICAgLSBHaGVudCBVbml2ZXJzaXR5Cm91dHB1dDogCiAgICBodG1sX2RvY3VtZW50OgogICAgICBjb2RlX2ZvbGRpbmc6IGhpZGUKICAgICAgY29kZV9kb3dubG9hZDogdHJ1ZQogICAgICB0aGVtZTogZmxhdGx5CiAgICAgIHRvYzogdHJ1ZQogICAgICB0b2NfZmxvYXQ6IHRydWUKICAgICAgaGlnaGxpZ2h0OiB0YW5nbwogICAgICBudW1iZXJfc2VjdGlvbnM6IHRydWUKbGlua2NvbG9yOiBibHVlCnVybGNvbG9yOiBibHVlCmNpdGVjb2xvcjogYmx1ZQotLS0KCgojIGxvYWQgbGlicmFyaWVzCgpgYGB7cn0Kc3VwcHJlc3NQYWNrYWdlU3RhcnR1cE1lc3NhZ2VzKHsKbGlicmFyeSh0aWR5dmVyc2UpCmxpYnJhcnkoVGFyZ2V0RGVjb3kpCmxpYnJhcnkoUkN1cmwpCn0pCmBgYAoKIyBEb3dubG9hZCBkYXRhIGZyb20gWmVub2RvCiAKYGBge3J9CiMgRG93bmxvYWQgZGF0YSBmcm9tIHplbm9kbwpvcHRpb25zKHRpbWVvdXQ9MzAwKQp1cmwgPC0gImh0dHBzOi8vemVub2RvLm9yZy9yZWNvcmQvNzMwODAyMi9maWxlcy9zZWFyY2gtcmVzdWx0cy56aXA/ZG93bmxvYWQ9MSIKZGVzdEZpbGUgPC0gInNlYXJjaFJlc3VsdHMuemlwIgppZiAoIWZpbGUuZXhpc3RzKGRlc3RGaWxlKSkgZG93bmxvYWQuZmlsZSh1cmwsIGRlc3RGaWxlKQp1bnppcChkZXN0RmlsZSwgZXhkaXIgPSAiLi9kYXRhIiwgb3ZlcndyaXRlID0gVFJVRSkKYGBgCgojIFB5cm9jb2NjdXMgCgojIyBJbXBvcnQgUHlyb2NvY2N1cyBEYXRhIGluIFIKCmBgYHtyfQphbGxUc3ZGaWxlcyA8LSBsaXN0LmZpbGVzKAogIHBhdGggPSAiZGF0YSIsIAogIHBhdHRlcm4gPSAiLnRzdiQiLAogIGZ1bGwubmFtZXMgPSBUUlVFKQptc2dmRmlsZXMgPC0gYWxsVHN2RmlsZXNbZ3JlcGwoIm1zZ2YiLGFsbFRzdkZpbGVzKSZncmVwbCgiUFhEMDAxMDc3IixhbGxUc3ZGaWxlcyldCmRmc21zZ2YgPC0gbGFwcGx5KG1zZ2ZGaWxlcywgcmVhZF90c3YpCmNyYXBFbnRyaWVzIDwtIHNjYW4oImRiLWdwbS1jcmFwLWVudHJpZXMudHh0Iiwgd2hhdCA9ICJjaGFyYWN0ZXIiKQpkZnNtc2dmIDwtIGxhcHBseShkZnNtc2dmLCBmdW5jdGlvbihkYikgCiAgZGJbcm93U3VtcyhzYXBwbHkoY3JhcEVudHJpZXMsIGdyZXBsLGZpeGVkPVRSVUUseCA9IGRiJHByb3RlaW5fbGlzdCkpID09IDAsXSkKCnRhbmRlbUZpbGVzIDwtIGFsbFRzdkZpbGVzW2dyZXBsKCJ4dGFuZGVtIixhbGxUc3ZGaWxlcykmZ3JlcGwoIlBYRDAwMTA3NyIsYWxsVHN2RmlsZXMpXQpkZnNUYW5kZW0gPC0gbGFwcGx5KHRhbmRlbUZpbGVzLCByZWFkX3RzdikKZGZzVGFuZGVtIDwtIGxhcHBseShkZnNUYW5kZW0sIGZ1bmN0aW9uKGRiKSAKICBkYltyb3dTdW1zKHNhcHBseShjcmFwRW50cmllcywgZ3JlcGwsZml4ZWQ9VFJVRSx4ID0gZGIkcHJvdGVpbl9saXN0KSkgPT0gMCxdKQpgYGAKCiMjIEZEUiBmdW5jdGlvbiAKCkNhbGN1bGF0ZSBGRFIgb24gdGliYmxlIHdpdGggc2VhcmNoIHJlc3VsdHMuIEl0IGlzIGFzc3VtZWQgdGhhdCBoaWdoZXIgc2NvcmVzIGFyZSBiZXR0ZXIuIAoKYGBge3J9CiMgRkRSIGZ1bmN0aW9uCmZkckRiIDwtIGZ1bmN0aW9uKGRiKQp7CiAgZGIgPC0gZGIgJT4lIAogICAgYXJyYW5nZShkZXNjKHNjb3JlKSkgJT4lIAogICAgbXV0YXRlKEZQID0gY3Vtc3VtKGlzX2RlY295KSwKICAgICAgICAgICBGRFIgPSBjdW1zdW0oaXNfZGVjb3kpL2N1bXN1bSghaXNfZGVjb3kpKQogIEZEUiA8LSBkYiRGRFIKICBGRFJtaW4gPC0gRkRSW2xlbmd0aChGRFIpXQogIGZvciAoaiBpbiAobGVuZ3RoKEZEUiktMSk6MSkKICB7CiAgICBpZiAoRkRSW2pdIDwgRkRSbWluKQogICAgICBGRFJtaW4gPC0gRkRSW2pdIGVsc2UKICAgICAgRkRSW2pdIDwtIEZEUm1pbiAgIAogIH0KICBkYiRGRFIgPC0gRkRSCiAgZGIgPC0gZGIgJT4lIAogICAgYXJyYW5nZShzcGVjdHJ1bV9pZCkgCiAgcmV0dXJuKGRiKQp9CmBgYAoKIyMgR2VuZXJhdGUgcGxvdHMgZm9yIE1TR0YrICAKCkhpc3RvZ3JhbXMgYW5kIFAtUCBwbG90cyBmb3IgcmFuazEsIHJhbmsgMiBhbmQgc2VhcmNoIGFnYWluc3QgaHVtYW4gREIuCgpgYGB7cn0KIyBHZW5lcmF0ZSBNU0dGKyBwbG90cyBweXJvY29jY3VzCmhpc3RzTXNnZiA8LSBsYXBwbHkoCiAgZGZzbXNnZiwKICBmdW5jdGlvbihkYiwgc2NvcmUsIGRlY295LCBsb2cxMCkgCiAgICBldmFsVGFyZ2V0RGVjb3lzSGlzdCgKICAgICAgZGIgJT4lIGZpbHRlcihyYW5rPT0xKSwgCiAgICAgIGRlY295LCAKICAgICAgc2NvcmUsIAogICAgICBsb2cxMCkgKyAKICAgIHhsYWIoIlNjb3JlIikgKyAKICAgIGdndGl0bGUoTlVMTCkgKyAgIAogICAgZ2VvbV9oaXN0b2dyYW0oCiAgICAgIGJpbnMgPSA1MCwgCiAgICAgIHBvc2l0aW9uID0gImlkZW50aXR5IiwKICAgICAgYWxwaGEgPSAuOSksIAogIHNjb3JlID0gInNjb3JlIiwgCiAgZGVjb3kgPSAiaXNfZGVjb3kiLCAKICBsb2cxMCA9IFRSVUUpCmhpc3RzTXNnZlIyIDwtIGxhcHBseSgKICBkZnNtc2dmLAogIGZ1bmN0aW9uKGRiLCBzY29yZSwgZGVjb3ksIGxvZzEwKSAKICAgIGV2YWxUYXJnZXREZWNveXNIaXN0KGRiICU+JSBmaWx0ZXIocmFuaz09MiksIAogICAgICAgICAgICAgICAgICAgICAgICAgZGVjb3ksIAogICAgICAgICAgICAgICAgICAgICAgICAgc2NvcmUsIAogICAgICAgICAgICAgICAgICAgICAgICAgbG9nMTApICsgCiAgICB4bGFiKCJTY29yZSIpICsgCiAgICBnZ3RpdGxlKE5VTEwpICsgIAogICAgZ2VvbV9oaXN0b2dyYW0oYmlucz01MCwgcG9zaXRpb249ImlkZW50aXR5IixhbHBoYT0uOSksIAogIHNjb3JlID0gInNjb3JlIiwgCiAgZGVjb3kgPSAiaXNfZGVjb3kiLCAKICBsb2cxMCA9IFRSVUUpCnBwUGxvdHNNc2dmIDwtIGxhcHBseShkZnNtc2dmLAogICAgICAgICAgICAgICAgICAgICAgZnVuY3Rpb24oZGIsIHNjb3JlLCBkZWNveSwgbG9nMTApIAogICAgICAgICAgICAgICAgICAgICAgICBldmFsVGFyZ2V0RGVjb3lzUFBQbG90KGRiICU+JSBmaWx0ZXIocmFuaz09MSksIAogICAgICAgICAgICAgICAgICAgICAgICAgICAgICAgICAgICAgICAgICAgICAgIGRlY295LCAKICAgICAgICAgICAgICAgICAgICAgICAgICAgICAgICAgICAgICAgICAgICAgICBzY29yZSwgCiAgICAgICAgICAgICAgICAgICAgICAgICAgICAgICAgICAgICAgICAgICAgICAgbG9nMTApICsgCiAgICAgICAgICAgICAgICAgICAgICAgIGdndGl0bGUoTlVMTCkgKwogICAgICAgICAgICAgICAgICAgICAgICB4bGFiKCJGZCIpICsKICAgICAgICAgICAgICAgICAgICAgICAgeWxhYigiRnQiKSwgCiAgICAgICAgICAgICAgICAgICAgICBzY29yZSA9ICJzY29yZSIsIAogICAgICAgICAgICAgICAgICAgICAgZGVjb3kgPSAiaXNfZGVjb3kiLCAKICAgICAgICAgICAgICAgICAgICAgIGxvZzEwPVRSVUUpCgpweXJvSWQgPC0gd2hpY2goCiAgZ3JlcGwoCiAgICBwYXR0ZXJuID0gInN3aXNzcHJvdCIsCiAgICBtc2dmRmlsZXMsCiAgICBmaXhlZCA9IFRSVUUpICYgCiAgICBncmVwbCgKICAgICAgcGF0dGVybiA9ICJwZnVyaW9zdXMiLAogICAgICBtc2dmRmlsZXMsCiAgICAgIGZpeGVkID0gVFJVRSkKICApIAoKZGZIbHAgPC0gZGZzbXNnZltbcHlyb0lkXV0gICU+JSAKICBmaWx0ZXIocmFuaz09MSkgJT4lIAogIG11dGF0ZShzY29yZSA9IC1sb2cxMChzY29yZSkpICU+JQogIGZkckRiKCkKdGhyZXNoIDwtIGRmSGxwICU+JSAgCiAgZmlsdGVyKEZEUiA8IDAuMDEpICU+JSAKICBwdWxsKHNjb3JlKSAlPiUgCiAgbWluCm5TaWcgPC0gZGZIbHAgJT4lIGZpbHRlcihGRFIgPCAwLjAxKSAlPiUgcHVsbChpc19kZWNveSkgJT4lIGAhYCAlPiUgc3VtCgpodW1hbklkIDwtIHdoaWNoKAogIGdyZXBsKHBhdHRlcm49InN3aXNzcHJvdCIsbXNnZkZpbGVzLGZpeGVkID0gVFJVRSkgJiBncmVwbChwYXR0ZXJuPSJoc2FwaWVucyIsbXNnZkZpbGVzLGZpeGVkID0gVFJVRSkKICApIAoKZmlnTXNnZlN3aXNzSGlzdHNQeXJvUjFSMl9IdW1hbiA8LSBncmlkRXh0cmE6OmdyaWQuYXJyYW5nZSgKICAgICAgaGlzdHNNc2dmW1tweXJvSWRdXSArCiAgICAgICAgZ2VvbV9oaXN0b2dyYW0oCiAgICAgICAgICBiaW5zID0gNTAsIAogICAgICAgICAgcG9zaXRpb24gPSAiaWRlbnRpdHkiLAogICAgICAgICAgYWxwaGEgPSAuOSkgKwogICAgICAgICBnZ3RpdGxlKHBhc3RlKG5TaWcsInRhcmdldCBQU01zIGF0IDElIEZEUiIpKSArCiAgICAgICAgYW5ub3RhdGUoInJlY3QiLCAKICAgICAgICAgICAgICAgICB4bWluID0gdGhyZXNoLCAKICAgICAgICAgICAgICAgICB4bWF4ID0gMzUsIAogICAgICAgICAgICAgICAgIHltaW4gPSAtMTAsIAogICAgICAgICAgICAgICAgIHltYXggPSAxNjAwLCAKICAgICAgICAgICAgICAgICBhbHBoYSA9IC4yKSArIAogICAgICBhbm5vdGF0ZShnZW9tID0gInRleHQiLCAKICAgICAgICAgICAgICAgeCA9IHRocmVzaCsxLCAKICAgICAgICAgICAgICAgeSA9IDE1MDAsIAogICAgICAgICAgICAgICBsYWJlbCA9ICJ4ID4gdFsnMSUgRkRSJ10iLAogICAgICAgICAgICAgIGNvbG9yID0gImJsYWNrIiwKICAgICAgICAgICAgICBoanVzdCA9IDAgLAogICAgICAgICAgICAgIHBhcnNlID0gVFJVRSkgKwogICAgICAgIGFubm90YXRlKGdlb20gPSAicmVjdCIsCiAgICAgICAgICAgICAgICAgeG1pbiA9IHRocmVzaCwKICAgICAgICAgICAgICAgICB4bWF4ID0gdGhyZXNoLAogICAgICAgICAgICAgICAgIHltaW4gPSAwLAogICAgICAgICAgICAgICAgIHltYXggPSAxNjAwLAogICAgICAgICAgICAgICAgIGNvbG9yID0gInJlZCIpICsKICAgICAgICAgdGhlbWUobGVnZW5kLnBvc2l0aW9uID0gYygwLjc1LDAuNzUpKSwKICAgIGhpc3RzTXNnZlIyW1tweXJvSWRdXSArIAogICAgICAgICBnZW9tX2hpc3RvZ3JhbSgKICAgICAgICAgICBiaW5zID0gNTAsIAogICAgICAgICAgIHBvc2l0aW9uID0gImlkZW50aXR5IiwKICAgICAgICAgICBhbHBoYSA9IC45KSArCiAgICAgICAgIGdndGl0bGUoIlJhbmsgMiBQU01zIikgKwogICAgICAgICB0aGVtZShsZWdlbmQucG9zaXRpb24gPSBjKDAuNzUsMC43NSkpLAogICAgaGlzdHNNc2dmW1todW1hbklkXV0gKyAKICAgICAgICAgZ2VvbV9oaXN0b2dyYW0oCiAgICAgICAgICAgYmlucyA9IDUwLCAKICAgICAgICAgICBwb3NpdGlvbiA9ICJpZGVudGl0eSIsCiAgICAgICAgICAgYWxwaGEgPSAuOSkgKwogICAgICAgICBnZ3RpdGxlKCJTcGVjdHJhIG1hdGNoZWQgdG8gSC4gc2FwaWVucyIpICsKICAgICAgICAgdGhlbWUobGVnZW5kLnBvc2l0aW9uID0gYygwLjc1LDAuNzUpKSwKICAgIG5jb2w9MykKCmdnc2F2ZSggCiAgIi4vZmlncy9maWdNc2dmU3dpc3NIaXN0c1B5cm9SMVIyX0h1bWFuLnBuZyIsIAogIHBsb3QgPSBmaWdNc2dmU3dpc3NIaXN0c1B5cm9SMVIyX0h1bWFuLAogIGRldmljZSA9ICJwbmciLCAKICB3aWR0aCA9IDExLjcsCiAgaGVpZ2h0ID0gMy45KQoKZ2dzYXZlKCAKICAiLi90aWZmcy9maWdNc2dmU3dpc3NIaXN0c1B5cm9SMVIyX0h1bWFuLnRpZmYiLCAKICBwbG90ID0gZmlnTXNnZlN3aXNzSGlzdHNQeXJvUjFSMl9IdW1hbiwKICBkZXZpY2UgPSAidGlmZiIsIAogIHdpZHRoID0gMTEuNywKICBoZWlnaHQgPSAzLjkpCgpmaWdNc2dmU3dpc3NQUHBsb3RzUHlyb19IdW1hbiA8LSAKICAgIGdyaWRFeHRyYTo6Z3JpZC5hcnJhbmdlKAogICAgICBwcFBsb3RzTXNnZltbaHVtYW5JZF1dICsgCiAgICAgICAgIGdndGl0bGUoTlVMTCksCiAgICAgICBwcFBsb3RzTXNnZltbcHlyb0lkXV0gKyAKICAgICAgICAgZ2d0aXRsZShOVUxMKSwKICAgICAgIG5jb2w9MikKCmdnc2F2ZSggCiAgIi4vZmlncy9maWdNc2dmU3dpc3NQUHBsb3RzUHlyb19IdW1hbi5wbmciLCAKICBwbG90ID0gZmlnTXNnZlN3aXNzUFBwbG90c1B5cm9fSHVtYW4sCiAgZGV2aWNlID0gInBuZyIsIAogIHdpZHRoID0gNy44LCAKICBoZWlnaHQgPSAzLjkpCgpnZ3NhdmUoIAogICIuL3RpZmZzL2ZpZ01zZ2ZTd2lzc1BQcGxvdHNQeXJvX0h1bWFuLnRpZmYiLCAKICBwbG90ID0gZmlnTXNnZlN3aXNzUFBwbG90c1B5cm9fSHVtYW4sCiAgZGV2aWNlID0gInRpZmYiLCAKICB3aWR0aCA9IDcuOCwgCiAgaGVpZ2h0ID0gMy45KQpgYGAKCiMjIFgtdGFuZGVtIHNlYXJjaGVzCgojIyMgUHJlcHJvY2VzcyB0YW5kZW0gZGF0YQoKQ29udmVydCBzcGVjdHJ1bSBpZCBpbnRvIGRvdWJsZSBmb3Igc29ydGluZyArIGFkZCBGRFIKCmBgYHtyfQojIFByZXByb2Nlc3MgVGFuZGVtIHB5cm9jb2NjdXMgcmVzdWx0cwpmb3IgKGkgaW4gMTpsZW5ndGgoZGZzVGFuZGVtKSkKewogIAogIGRmc1RhbmRlbVtbaV1dIDwtIGRmc1RhbmRlbVtbaV1dICU+JQogICAgbXV0YXRlKHNwZWN0cnVtX2lkX29yaWcgPSBzcGVjdHJ1bV9pZCwKICAgICAgICAgICBzcGVjdHJ1bV9pZCA9IHNhcHBseSgKICAgICAgICAgICAgIHNwZWN0cnVtX2lkICU+JSBzdHJzcGxpdChzcGxpdD0iICIpLCAKICAgICAgICAgICAgIGZ1bmN0aW9uKHgpIHN1YnN0cih4WzNdLDYsMTAwMCkpICU+JSBhcy5kb3VibGUKICAgICkKfQpkZnNUYW5kZW0gPC0gbGFwcGx5KGRmc1RhbmRlbSwgZmRyRGIpCmBgYAoKIyMjIFBsb3RzIGZvciBzZWFyY2ggd2l0aCBhbmQgd2l0aG91dCByZWZpbmVtZW50LiAKCmBgYHtyfQojIHBsb3RzIHh0YW5kZW0gUmVzdWx0cwpoaXN0c1RhbmRlbSA8LSBsYXBwbHkoZGZzVGFuZGVtLAogICAgICAgICAgICAgICAgICAgICAgZXZhbFRhcmdldERlY295c0hpc3QsIAogICAgICAgICAgICAgICAgICAgICAgc2NvcmUgPSAic2NvcmUiLCAKICAgICAgICAgICAgICAgICAgICAgIGRlY295ID0gImlzX2RlY295IiwgCiAgICAgICAgICAgICAgICAgICAgICBsb2cxMCA9IEZBTFNFKQpwcFBsb3RzVGFuZGVtIDwtIGxhcHBseShkZnNUYW5kZW0sCiAgICAgICAgICAgICAgICAgICAgICAgIGV2YWxUYXJnZXREZWNveXNQUFBsb3QsIAogICAgICAgICAgICAgICAgICAgICAgICBzY29yZSA9ICJzY29yZSIsIAogICAgICAgICAgICAgICAgICAgICAgICBkZWNveSA9ICJpc19kZWNveSIsIAogICAgICAgICAgICAgICAgICAgICAgICBsb2cxMCA9IEZBTFNFKQoKbm9SZWZpbmVJZCA8LSB3aGljaChncmVwbCgibm8tcmVmaW5lIix0YW5kZW1GaWxlcykpCnJlZmluZUlkIDwtIHdoaWNoKCFncmVwbCgibm8tcmVmaW5lIix0YW5kZW1GaWxlcykpCgoKZmlnVGFuZGVtUmVmaW5lU3dpc3NIaXN0UFAgPC0gCiAgICBncmlkRXh0cmE6OmdyaWQuYXJyYW5nZSgKICAgICAgIGhpc3RzVGFuZGVtW1tyZWZpbmVJZF1dICsgCiAgICAgICAgIGdlb21faGlzdG9ncmFtKAogICAgICAgICAgIGJpbnMgPSA1MCwgCiAgICAgICAgICAgcG9zaXRpb24gPSAiaWRlbnRpdHkiLAogICAgICAgICAgIGFscGhhPS45KSArCiAgICAgICAgIHlsaW0oMCwgMTUwMCkgKwogICAgICAgICB4bGltKC02LjIsIDM1KSArCiAgICAgICAgIGdndGl0bGUoTlVMTCkgKwogICAgICAgICB0aGVtZShsZWdlbmQucG9zaXRpb24gPSBjKDAuNzUsMC43NSkpLAogICAgICAgcHBQbG90c1RhbmRlbVtbcmVmaW5lSWRdXSArIAogICAgICAgICBnZ3RpdGxlKE5VTEwpICsKICAgICAgICAgeWxpbSgwLC42KSwgCiAgICAgICBuY29sID0gMikKCmdnc2F2ZSggCiAgIi4vZmlncy9maWdUYW5kZW1SZWZpbmVTd2lzc0hpc3RQUC5wbmciLCAKICBwbG90ID0gIGZpZ1RhbmRlbVJlZmluZVN3aXNzSGlzdFBQLAogIGRldmljZSA9ICJwbmciLCAKICB3aWR0aCA9IDcuOCwgCiAgaGVpZ2h0ID0gMy45KQoKZ2dzYXZlKCAKICAiLi90aWZmcy9maWdUYW5kZW1SZWZpbmVTd2lzc0hpc3RQUC50aWZmIiwgCiAgcGxvdCA9ICBmaWdUYW5kZW1SZWZpbmVTd2lzc0hpc3RQUCwKICBkZXZpY2UgPSAidGlmZiIsIAogIHdpZHRoID0gNy44LCAKICBoZWlnaHQgPSAzLjkpCgoKZmlnVGFuZGVtTm9SZWZpbmVTd2lzc0hpc3RQUCA8LSAKICAgIGdyaWRFeHRyYTo6Z3JpZC5hcnJhbmdlKAogICAgICAgaGlzdHNUYW5kZW1bW25vUmVmaW5lSWRdXSArIAogICAgICAgIGdlb21faGlzdG9ncmFtKAogICAgICAgICAgYmlucyA9IDUwLCAKICAgICAgICAgIHBvc2l0aW9uID0gImlkZW50aXR5IiwKICAgICAgICAgIGFscGhhID0gLjkpICsKICAgICAgICAgeWxpbSgwLCAxNTAwKSArIAogICAgICAgICB4bGltKC02LjIsIDM1KSArCiAgICAgICAgIGdndGl0bGUoTlVMTCkgKyAKICAgICAgICAgdGhlbWUobGVnZW5kLnBvc2l0aW9uID0gYygwLjc1LDAuNzUpKSwKICAgICAgIHBwUGxvdHNUYW5kZW1bW25vUmVmaW5lSWRdXSArIAogICAgICAgICBnZ3RpdGxlKE5VTEwpICsKICAgICAgICAgeWxpbSgwLC42KSwgCiAgICAgICBuY29sPTIpCgpnZ3NhdmUoCiAgIi4vZmlncy9maWdUYW5kZW1Ob1JlZmluZVN3aXNzSGlzdFBQLnBuZyIsIAogIHBsb3QgPSBmaWdUYW5kZW1Ob1JlZmluZVN3aXNzSGlzdFBQLAogIGRldmljZSA9ICJwbmciLCAKICB3aWR0aCA9IDcuOCwgCiAgaGVpZ2h0ID0gMy45KQoKZ2dzYXZlKAogICIuL3RpZmZzL2ZpZ1RhbmRlbU5vUmVmaW5lU3dpc3NIaXN0UFAudGlmZiIsIAogIHBsb3QgPSBmaWdUYW5kZW1Ob1JlZmluZVN3aXNzSGlzdFBQLAogIGRldmljZSA9ICJ0aWZmIiwgCiAgd2lkdGggPSA3LjgsIAogIGhlaWdodCA9IDMuOSkKYGBgCgojIyMgUGxvdCB0byBzdHJhdGlmeSByZWZpbmVtZW50IHNlYXJjaGVkIHBlcHRpZGVzCgpDYWxjdWxhdGUgMSUgRkRSIHRocmVzaG9sZCBmb3IgcGxvdCAKCmBgYHtyfQp0aHJlc2ggPC0gZGZzVGFuZGVtW1tyZWZpbmVJZF1dICU+JSAgCiAgZmlsdGVyKEZEUiA8IDAuMDEpICU+JSAKICBwdWxsKHNjb3JlKSAlPiUgCiAgbWluCmBgYAoKSWRlbnRpZnkgdHlwZSBvZiBQU006IHNhbWUgbWF0Y2gsIHN3aWNoZWQgbWF0Y2ggb3IgbmV3IHNwZWN0cnVtIHVwb24gcmVmaW5lbWVudC4gCgpgYGB7cn0KZGZzVGFuZGVtW1tyZWZpbmVJZF1dJHJlZmluZSA8LSAic3dpdGNoZWQiCmRmc1RhbmRlbVtbcmVmaW5lSWRdXSRpbk5vUmVmaW5lIDwtIGRmc1RhbmRlbVtbcmVmaW5lSWRdXSRzcGVjdHJ1bV9pZCAlaW4lIAogIGRmc1RhbmRlbVtbbm9SZWZpbmVJZF1dJHNwZWN0cnVtX2lkCgpkZnNUYW5kZW1bW3JlZmluZUlkXV0kcmVmaW5lWyFkZnNUYW5kZW1bW3JlZmluZUlkXV0kaW5Ob1JlZmluZV0gPC0gIm5ldyIKCmRmUmVmaW5lQ29tbW9uIDwtIGRmc1RhbmRlbVtbcmVmaW5lSWRdXSAlPiUgCiAgZmlsdGVyKGluTm9SZWZpbmUpCgpkZnNUYW5kZW1bW25vUmVmaW5lSWRdXSRpblJlZmluZSA8LSBkZnNUYW5kZW1bW25vUmVmaW5lSWRdXSRzcGVjdHJ1bV9pZCAlaW4lIAogIGRmc1RhbmRlbVtbcmVmaW5lSWRdXSRzcGVjdHJ1bV9pZApkZk5vUmVmaW5lQ29tbW9uIDwtIGRmc1RhbmRlbVtbbm9SZWZpbmVJZF1dICU+JSAKICBmaWx0ZXIoaW5SZWZpbmUpCmRmUmVmaW5lQ29tbW9uJHJlZmluZVtkZlJlZmluZUNvbW1vbiRwZXB0aWRvZm9ybSA9PSBkZk5vUmVmaW5lQ29tbW9uJHBlcHRpZG9mb3JtXSA8LSJzYW1lIgoKZGZzVGFuZGVtW1tyZWZpbmVJZF1dJHJlZmluZVtkZnNUYW5kZW1bW3JlZmluZUlkXV0kaW5Ob1JlZmluZV0gPC0gZGZSZWZpbmVDb21tb24kcmVmaW5lCmRmc1RhbmRlbVtbcmVmaW5lSWRdXSRyZWZpbmVURCA8LSBwYXN0ZSgKICBkZnNUYW5kZW1bW3JlZmluZUlkXV0kcmVmaW5lLAogIGlmZWxzZSgKICAgIGRmc1RhbmRlbVtbcmVmaW5lSWRdXSRpc19kZWNveSwKICAgICJkZWNveSIsCiAgICAidGFyZ2V0IikKICApICU+JSAKICBmYWN0b3IobGV2ZWxzID0gYygic2FtZSB0YXJnZXQiLCAKICAgICAgICAgICAgICAgICAgICAic2FtZSBkZWNveSIsCiAgICAgICAgICAgICAgICAgICAgIm5ldyB0YXJnZXQiLAogICAgICAgICAgICAgICAgICAgICJzd2l0Y2hlZCB0YXJnZXQiLAogICAgICAgICAgICAgICAgICAgICJuZXcgZGVjb3kiLAogICAgICAgICAgICAgICAgICAgICJzd2l0Y2hlZCBkZWNveSIpCiAgICAgICAgICkKYGBgCgpDb25zdHJ1Y3QgZmlndXJlIHdpdGggaGlzdG9ncmFtcyBzdHJhdGVmaWVkIGFjY29yZGluZyB0byBQU00gdHlwZS4gCgpgYGB7cn0KZmlnc1RhbmRlbVN3aXNzUmVmaW5lbWVudEhpc3RQc21UeXBlIDwtIGRmc1RhbmRlbVtbcmVmaW5lSWRdXSAlPiUgCiAgZ2dwbG90KGFlcyh4ID0gc2NvcmUsCiAgICAgICAgICAgICBmaWxsID0gcmVmaW5lVEQsIAogICAgICAgICAgICAgY29sID0gSSgiYmxhY2siKSkpICsKICBnZW9tX2hpc3RvZ3JhbShiaW5zID0gNTAsIAogICAgICAgICAgICAgICAgIHBvc2l0aW9uID0gImlkZW50aXR5IiwKICAgICAgICAgICAgICAgICBhbHBoYSA9IC45KSArICAgCiAgc2NhbGVfZmlsbF9tYW51YWwoCiAgICAidmFsdWVzIiA9IGMoYHNhbWUgdGFyZ2V0YCA9ICIjMDA5OTAwIiwKICAgICAgICAgICAgICAgICBgc2FtZSBkZWNveWAgPSAiI0ZGOTkwMCIsIAogICAgICAgICAgICAgICAgIGBuZXcgdGFyZ2V0YCA9ICIjNWRmNTQyIiwgCiAgICAgICAgICAgICAgICAgYG5ldyBkZWNveWA9IiNjMDM2MDAiLAogICAgICAgICAgICAgICAgIGBzd2l0Y2hlZCB0YXJnZXRgPSIjNDJmNWM4IiwKICAgICAgICAgICAgICAgICBgc3dpdGNoZWQgZGVjb3lgID0gIiNmNTQyODEiKQogICAgKSArCiAgdGhlbWVfYncoKSArIAogIHRoZW1lKHBsb3QudGl0bGUgPSBlbGVtZW50X3RleHQoc2l6ZSA9IHJlbCgxLjUpKSwgCiAgICAgICAgYXhpcy50aXRsZSA9IGVsZW1lbnRfdGV4dChzaXplID0gcmVsKDEuMikpLCAKICAgICAgICBheGlzLnRleHQgPSBlbGVtZW50X3RleHQoc2l6ZSA9IHJlbCgxLjIpKSwgCiAgICAgICAgYXhpcy50aXRsZS55ID0gZWxlbWVudF90ZXh0KGFuZ2xlID0gMCkpCgpwc21UeXBlIDwtIGRmc1RhbmRlbVtbcmVmaW5lSWRdXSAlPiUgCiAgcHVsbChyZWZpbmVURCkgJT4lIAogIHRhYmxlCnBpMCA8LSBzdW0oZGZzVGFuZGVtW1tyZWZpbmVJZF1dJGlzX2RlY295KS8gc3VtKCFkZnNUYW5kZW1bW3JlZmluZUlkXV0kaXNfZGVjb3kpCnBpU2FtZSA8LSBwc21UeXBlWyJzYW1lIGRlY295Il0vc3VtKCFkZnNUYW5kZW1bW3JlZmluZUlkXV0kaXNfZGVjb3kpCnBpU2FtZU5ldyA8LSAocHNtVHlwZVsic2FtZSBkZWNveSJdK3BzbVR5cGVbIm5ldyBkZWNveSJdKS9zdW0oIWRmc1RhbmRlbVtbcmVmaW5lSWRdXSRpc19kZWNveSkKcGlTYW1lTmV3U3dpdGNoIDwtIChwc21UeXBlWyJzYW1lIGRlY295Il0rcHNtVHlwZVsibmV3IGRlY295Il0gKyBwc21UeXBlWyJzd2l0Y2hlZCBkZWNveSJdKS9zdW0oIWRmc1RhbmRlbVtbcmVmaW5lSWRdXSRpc19kZWNveSkKcGlTYW1lTmV3U3dpdGNoTmV3VGFyZ2V0IDwtIChwc21UeXBlWyJzYW1lIGRlY295Il0rcHNtVHlwZVsibmV3IGRlY295Il0gKyBwc21UeXBlWyJzd2l0Y2hlZCBkZWNveSJdICsgcHNtVHlwZVsibmV3IHRhcmdldCJdKS9zdW0oIWRmc1RhbmRlbVtbcmVmaW5lSWRdXSRpc19kZWNveSkKCgpmaWdUYW5kZW1SZWZpbmVTd2lzc1BTTXR5cGVIaXN0UFAgPC0gCiAgICBncmlkRXh0cmE6OmdyaWQuYXJyYW5nZSgKICAgICAgICAgZmlnc1RhbmRlbVN3aXNzUmVmaW5lbWVudEhpc3RQc21UeXBlICsKICAgICAgICAgICBnZ3RpdGxlKE5VTEwpICsKICAgICAgICAgICB5bGFiKE5VTEwpICsKICAgICAgICAgICB4bGltKC02LjIsIDM1KSArCiAgICAgICAgICAgdGhlbWUoCiAgICAgICAgICAgICBsZWdlbmQucG9zaXRpb24gPSBjKDAuNzMsMC42OCksCiAgICAgICAgICAgICBsZWdlbmQudGl0bGUgPSBlbGVtZW50X2JsYW5rKCkpICsKICAgICAgICAgICBhbm5vdGF0ZSgicmVjdCIsIAogICAgICAgICAgICAgICAgICAgIHhtaW4gPSB0aHJlc2gsCiAgICAgICAgICAgICAgICAgICAgeG1heCA9IDM1LCAKICAgICAgICAgICAgICAgICAgICB5bWluID0gLTEwLCAKICAgICAgICAgICAgICAgICAgICB5bWF4ID0gMTUwMCwgCiAgICAgICAgICAgICAgICAgICAgYWxwaGEgPSAuMikgKyAKICAgICAgYW5ub3RhdGUoZ2VvbSA9ICJ0ZXh0IiwgCiAgICAgICAgICAgICAgIHggPSB0aHJlc2grMSwgCiAgICAgICAgICAgICAgIHkgPSAxNDAwLCAKICAgICAgICAgICAgICAgbGFiZWwgPSAieCA+IHRbJzElIEZEUiddIiwKICAgICAgICAgICAgICAgY29sb3IgPSAiYmxhY2siLAogICAgICAgICAgICAgICBoanVzdCA9IDAgLAogICAgICAgICAgICAgICBwYXJzZSA9IFRSVUUpICsKICAgICAgICBhbm5vdGF0ZShnZW9tID0gInJlY3QiLAogICAgICAgICAgICAgICAgIHhtaW4gPSB0aHJlc2gsCiAgICAgICAgICAgICAgICAgeG1heCA9IHRocmVzaCwKICAgICAgICAgICAgICAgICB5bWluID0gMCwKICAgICAgICAgICAgICAgICB5bWF4ID0gMTUwMCwKICAgICAgICAgICAgICAgICBjb2xvciA9ICJyZWQiKSwgCiAgICAgICAgIHBwUGxvdHNUYW5kZW1bW3JlZmluZUlkXV0gKyAKICAgICAgICAgICBnZW9tX3BvbHlnb24oCiAgICAgICAgICAgICBhZXMoeCA9IHgsIHkgPSB5KSwKICAgICAgICAgICAgIGRhdGEgPSBkYXRhLmZyYW1lKAogICAgICAgICAgICAgICB4ID0gYygwLCAxLCAxKSwKICAgICAgICAgICAgICAgeSA9IGMoMCwgMCwgcGlTYW1lKSksCiAgICAgICAgICAgICBmaWxsID0gIiNGRjk5MDAiLAogICAgICAgICAgICAgaW5oZXJpdC5hZXMgPSBGQUxTRSkgKwogICAgICAgICAgIGdlb21fcG9seWdvbigKICAgICAgICAgICAgIGFlcyh4ID0geCx5ID0geSksCiAgICAgICAgICAgICBkYXRhID0gZGF0YS5mcmFtZSgKICAgICAgICAgICAgICAgeCA9IGMoMCwgMSwgMSksCiAgICAgICAgICAgICAgIHkgPSBjKDAsIHBpU2FtZSwgcGlTYW1lTmV3KSksCiAgICAgICAgICAgICBmaWxsID0gIiNjMDM2MDAiLAogICAgICAgICAgICAgaW5oZXJpdC5hZXMgPSBGQUxTRSkgKwogICAgICAgICAgIGdlb21fcG9seWdvbigKICAgICAgICAgICAgIGFlcyh4ID0geCx5ID0geSksCiAgICAgICAgICAgICBkYXRhID0gZGF0YS5mcmFtZSgKICAgICAgICAgICAgICAgeCA9IGMoMCwgMSwgMSksCiAgICAgICAgICAgICAgIHkgPSBjKDAsIHBpU2FtZU5ldywgcGlTYW1lTmV3U3dpdGNoKSksCiAgICAgICAgICAgICBmaWxsID0gIiNmNTQyODEiLAogICAgICAgICAgICAgaW5oZXJpdC5hZXMgPSBGQUxTRSkgKwogICAgICAgICAgIGdlb21fcG9seWdvbigKICAgICAgICAgICAgIGFlcyh4ID0geCx5ID0geSksCiAgICAgICAgICAgICBkYXRhID0gZGF0YS5mcmFtZSgKICAgICAgICAgICAgICAgeCA9IGMoMCwgMSwgMSksCiAgICAgICAgICAgICAgIHkgPSBjKDAsIHBpU2FtZU5ld1N3aXRjaCwgcGlTYW1lTmV3U3dpdGNoTmV3VGFyZ2V0KSksCiAgICAgICAgICAgICBmaWxsID0gIiM1ZGY1NDIiLAogICAgICAgICAgICAgaW5oZXJpdC5hZXMgPSBGQUxTRSkgKwogICAgICAgICAgIGdlb21fYWJsaW5lKHNsb3BlID0gcGkwKSArIAogICAgICAgICAgIGdlb21fYWJsaW5lKHNsb3BlID0gcGlTYW1lTmV3U3dpdGNoTmV3VGFyZ2V0KSArIAogICAgICAgICAgIHlsaW0oMCwgMC42KSArIAogICAgICAgICAgIGdndGl0bGUoTlVMTCksIAogICAgICBuY29sID0gMikKCmdnc2F2ZSgiLi9maWdzL2ZpZ1RhbmRlbVJlZmluZVN3aXNzUFNNdHlwZUhpc3RQUC5wbmciLCAKICAgICAgIHBsb3QgPSBmaWdUYW5kZW1SZWZpbmVTd2lzc1BTTXR5cGVIaXN0UFAsCiAgICAgICBkZXZpY2UgPSAicG5nIiwgCiAgICAgICB3aWR0aCA9IDcuOCwgCiAgICAgICBoZWlnaHQgPSAzLjkpCgpnZ3NhdmUoIi4vdGlmZnMvZmlnVGFuZGVtUmVmaW5lU3dpc3NQU010eXBlSGlzdFBQLnRpZmYiLCAKICAgICAgIHBsb3QgPSBmaWdUYW5kZW1SZWZpbmVTd2lzc1BTTXR5cGVIaXN0UFAsCiAgICAgICBkZXZpY2UgPSAidGlmZiIsIAogICAgICAgd2lkdGggPSA3LjgsIAogICAgICAgaGVpZ2h0ID0gMy45KQpgYGAKCiMgSHVtYW4gc2FtcGxlIAoKTWFrZSBkaWFnbm9zdGljIHBsb3RzIGZvciByYW5rIDEgYW5kIHJhbmsgMi4gCgpgYGB7cn0KIyBQLVAgcGxvdCBmb3IgaHVtYW4gc2FtcGxlIApwYXRoMkZpbGUgPC0gIi4vZGF0YS9QWEQwMjg3MzUtTEZRX09yYml0cmFwX0REQV9IdW1hbl8wMV91bmlwcm90LWhzYXBpZW5zLWNhbm9uaWNhbC1pc29mb3Jtcy1jcmFwX21zZ2ZwbHVzLXBob3NwaG8ubXNnZi5temlkLnRzdiIKZGYgPC0gcmVhZF90c3YocGF0aDJGaWxlKQpkZiA8LSBkZlsKICByb3dTdW1zKAogICAgc2FwcGx5KGNyYXBFbnRyaWVzLCAKICAgICAgICAgICBncmVwbCwKICAgICAgICAgICBmaXhlZCA9IFRSVUUsCiAgICAgICAgICAgeCA9IGRmJHByb3RlaW5fbGlzdCkKICAgICkgPT0gMCxdCgoKCmZpZ0h1bWFuTXNnZlBsdXMgPC0gZ3JpZEV4dHJhOjpncmlkLmFycmFuZ2UoCiAgICBldmFsVGFyZ2V0RGVjb3lzSGlzdCgKICAgICAgZGYgJT4lIGZpbHRlcihyYW5rPT0xKSwKICAgICAgImlzX2RlY295IiwKICAgICAgInNjb3JlIiwKICAgICAgVFJVRSkgKyAKICAgICAgZ2d0aXRsZShOVUxMKSArCiAgICAgIGdlb21faGlzdG9ncmFtKGJpbnMgPSA1MCwgCiAgICAgICAgICAgICAgICAgICAgIGFscGhhID0gLjksIAogICAgICAgICAgICAgICAgICAgICBwb3NpdGlvbiA9ICJpZGVudGl0eSIpICsKICAgICAgdGhlbWUoCiAgICAgICAgICAgICBsZWdlbmQucG9zaXRpb24gPSBjKDAuNzUsMC43NSksCiAgICAgICAgICAgICApLAogICAgZXZhbFRhcmdldERlY295c1BQUGxvdCgKICAgICAgZGYgJT4lIGZpbHRlcihyYW5rPT0xKSwKICAgICAgImlzX2RlY295IiwgCiAgICAgICJzY29yZSIsCiAgICAgIFRSVUUpICsgCiAgICAgIGdndGl0bGUoTlVMTCksCiAgICBuY29sID0gMgogICkKZ2dzYXZlKAogIGZpbGVuYW1lID0gIi4vZmlncy9maWdIdW1hbk1zZ2ZQbHVzLnBuZyIsCiAgcGxvdCA9IGZpZ0h1bWFuTXNnZlBsdXMsCiAgZGV2aWNlID0gInBuZyIsIAogIHdpZHRoID0gNy44LCAKICBoZWlnaHQgPSAzLjkpCgpnZ3NhdmUoCiAgZmlsZW5hbWUgPSAiLi90aWZmcy9maWdIdW1hbk1zZ2ZQbHVzLnRpZmYiLAogIHBsb3QgPSBmaWdIdW1hbk1zZ2ZQbHVzLAogIGRldmljZSA9ICJ0aWZmIiwgCiAgd2lkdGggPSA3LjgsIAogIGhlaWdodCA9IDMuOSkKCgpmaWdIdW1hbk1zZ2ZQbHVzUjIgPC0gCiAgICBncmlkRXh0cmE6OmdyaWQuYXJyYW5nZSgKICAgICBldmFsVGFyZ2V0RGVjb3lzSGlzdCgKICAgICAgZGYgJT4lIGZpbHRlcihyYW5rPT0yKSwKICAgICAgImlzX2RlY295IiwKICAgICAgInNjb3JlIiwKICAgICAgVFJVRSkgKyAKICAgICAgZ2d0aXRsZShOVUxMKSArCiAgICAgIGdlb21faGlzdG9ncmFtKGJpbnMgPSA1MCwgCiAgICAgICAgICAgICAgICAgICAgIGFscGhhID0gLjksCiAgICAgICAgcG9zaXRpb24gPSAiaWRlbnRpdHkiKSArCiAgICAgIHRoZW1lKGxlZ2VuZC5wb3NpdGlvbiA9IGMoMC43NSwwLjc1KSksCiAgICBldmFsVGFyZ2V0RGVjb3lzUFBQbG90KGRmICU+JSBmaWx0ZXIocmFuaz09MiksCiAgICAgICAgICAgICAgICAgICAgICAgICAgICJpc19kZWNveSIsIAogICAgICAgICAgICAgICAgICAgICAgICAgICAic2NvcmUiLAogICAgICAgICAgICAgICAgICAgICAgICAgICBUUlVFKSArIAogICAgICBnZ3RpdGxlKE5VTEwpLAogICAgbmNvbCA9IDIKICApCgpnZ3NhdmUoCiAgZmlsZW5hbWUgPSAiLi9maWdzL2ZpZ0h1bWFuTXNnZlBsdXNSMi5wbmciLAogIHBsb3QgPSBmaWdIdW1hbk1zZ2ZQbHVzUjIsCiAgZGV2aWNlID0gInBuZyIsIAogIHdpZHRoID0gNy44LCAKICBoZWlnaHQgPSAzLjkpCgpnZ3NhdmUoCiAgZmlsZW5hbWUgPSAiLi90aWZmcy9maWdIdW1hbk1zZ2ZQbHVzUjIudGlmZiIsCiAgcGxvdCA9IGZpZ0h1bWFuTXNnZlBsdXNSMiwKICBkZXZpY2UgPSAidGlmZiIsIAogIHdpZHRoID0gNy44LCAKICBoZWlnaHQgPSAzLjkpCmBgYAoKIyBJbW11bm9wZXB0aWRvbWljcyAKCk1ha2UgZGlhZ25vc3RpYyBwbG90cyAKCmBgYHtyfQojIHBsb3QgaW1tdW5vcGVwdGlkb21pY3MgcGxvdApwYXRoMkZpbGUgPC0gIi4vZGF0YS9pbW11bm9wZXB0aWRvbWljc19tc21zX0lBQS50eHQiCmRmIDwtIHJlYWRfdHN2KHBhdGgyRmlsZSkKCgpmaWdQZXB0aWRvbWljcyA8LSAKICAgIGdyaWRFeHRyYTo6Z3JpZC5hcnJhbmdlKAogICAgZXZhbFRhcmdldERlY295c0hpc3QoZGYsCiAgICAgICAgICAgICAgICAgICAgICAgICAiaXNfZGVjb3kiLCAKICAgICAgICAgICAgICAgICAgICAgICAgICJzY29yZSIsCiAgICAgICAgICAgICAgICAgICAgICAgICBGQUxTRSkgKyAKICAgICAgZ2VvbV9oaXN0b2dyYW0oYmlucyA9IDUwLAogICAgICAgICAgICAgICAgICAgICBhbHBoYSA9IC45LCAKICAgICAgICAgICAgICAgICAgICAgcG9zaXRpb24gPSAiaWRlbnRpdHkiKSArCiAgICAgIGdndGl0bGUoTlVMTCkgKwogICAgICB0aGVtZShsZWdlbmQucG9zaXRpb24gPSBjKDAuMywwLjcpKSwKICAgIGV2YWxUYXJnZXREZWNveXNQUFBsb3QoZGYsCiAgICAgICAgICAgICAgICAgICAgICAgICAgICJpc19kZWNveSIsIAogICAgICAgICAgICAgICAgICAgICAgICAgICAic2NvcmUiLAogICAgICAgICAgICAgICAgICAgICAgICAgICBGQUxTRSkgKyAKICAgICAgeGxhYigiRmQiKSArIAogICAgICB5bGFiKCJGdCIpICsKICAgICAgZ2d0aXRsZShOVUxMKSwKICAgIG5jb2wgPSAyCiAgKQoKZ2dzYXZlKAogIGZpbGVuYW1lID0gIi4vZmlncy9maWdQZXB0aWRvbWljcy5wbmciLAogIHBsb3QgPSBmaWdQZXB0aWRvbWljcywKICBkZXZpY2UgPSAicG5nIiwgCiAgd2lkdGggPSA3LjgsIAogIGhlaWdodCA9IDMuOSkKCmdnc2F2ZSgKICBmaWxlbmFtZSA9ICIuL3RpZmZzL2ZpZ1BlcHRpZG9taWNzLnRpZmYiLAogIHBsb3QgPSBmaWdQZXB0aWRvbWljcywKICBkZXZpY2UgPSAidGlmZiIsIAogIHdpZHRoID0gNy44LCAKICBoZWlnaHQgPSAzLjkpCmBgYAoKIyBKb2ludCBQLVBsb3QgCgpQdXQgc2VhcmNoZXMgb2YgTVNHRisgYW5kIFhUYW5kZW0gd2l0aCByZWZpbmVtZW50IG9uIG9uZSBwbG90LiAKCmBgYHtyfQojIEpvaW50IFBQLXBsb3QKbXNnZklkIDwtIHdoaWNoKAogIGdyZXBsKAogICAgcGF0dGVybiA9ICJzd2lzc3Byb3QiLAogICAgbXNnZkZpbGVzLAogICAgZml4ZWQgPSBUUlVFKSAmIAogICAgZ3JlcGwocGF0dGVybiA9ICJwZnVyaW9zdXMiLAogICAgICAgICAgbXNnZkZpbGVzLAogICAgICAgICAgZml4ZWQgPSBUUlVFKQogICkgCgpoIDwtIFRhcmdldERlY295Ojo6cHJvY2Vzc09iamVjdHMoCiAgbGlzdChkZnNUYW5kZW1bW3JlZmluZUlkXV0sCiAgICAgICBkZnNtc2dmW1ttc2dmSWRdXSAlPiUgZmlsdGVyKHJhbms9PTEpKSwKICBkZWNveSA9IGMoImlzX2RlY295IiwgImlzX2RlY295IiksCiAgc2NvcmUgPSBjKCJzY29yZSIsICJzY29yZSIpLAogIGxvZzEwPWMoRkFMU0UsIFRSVUUpCiAgKSAlPiUgCiAgVGFyZ2V0RGVjb3k6OjpwcFNjb3Jlc0RhdGEoKQoKam9pbnRQbG90IDwtICBoJGRmICU+JQogICAgZ2dwbG90KGFlcyhGZHAsIHosIGNvbG9yID0gaWQgJT4lIGFzLmZhY3RvcikpICsgCiAgICBnZW9tX3BvaW50KCkgKwogICAgZ2VvbV9hYmxpbmUoc2xvcGUgPSAwKSArIAogICAgdGhlbWVfYncoKSArIAogICAgdGhlbWUobGVnZW5kLnRpdGxlID0gZWxlbWVudF9ibGFuaygpLAogICAgICAgICAgbGVnZW5kLnBvc2l0aW9uID0gYygwLjIsLjg1KSkgKwogICAgeWxhYigiRnQtcGkwIikgKwogICAgc2NhbGVfY29sb3JfZGlzY3JldGUobGFiZWxzPWMoIlghVGFuZGVtIiwiTVNHRisiKSkgKwogICAgeGxhYigiRmQiKQoKam9pbnRQbG90CgpnZ3NhdmUoCiAgZmlsZSA9ICIuL2ZpZ3MvZmlnVGFuZGVtTXNHZlN3aXNzQ29tYmluZGVkUFAucG5nIiwKICBwbG90ID0gam9pbnRQbG90LAogIGRldmljZSA9ICJwbmciLCAKICB3aWR0aCA9IDMuOSwgCiAgaGVpZ2h0ID0gMy45KQoKZ2dzYXZlKAogIGZpbGUgPSAiLi90aWZmcy9maWdUYW5kZW1Nc0dmU3dpc3NDb21iaW5kZWRQUC50aWZmIiwKICBwbG90ID0gam9pbnRQbG90LAogIGRldmljZSA9ICJ0aWZmIiwgCiAgd2lkdGggPSAzLjksIAogIGhlaWdodCA9IDMuOSkKYGBgCgoKIyBHcmFwaGljYWwgYWJzdHJhY3QgCgpgYGB7cn0KaGlzdHNUYW5kZW0yNSA8LSBsYXBwbHkoZGZzVGFuZGVtLAogICAgICAgICAgICAgICAgICAgICAgICBldmFsVGFyZ2V0RGVjb3lzSGlzdCwgCiAgICAgICAgICAgICAgICAgICAgICAgIHNjb3JlPSJzY29yZSIsIAogICAgICAgICAgICAgICAgICAgICAgICBkZWNveT0iaXNfZGVjb3kiLCAKICAgICAgICAgICAgICAgICAgICAgICAgbG9nMTAgPSBGQUxTRSwKICAgICAgICAgICAgICAgICAgICAgICAgbkJpbnMgPSAyNSkKCmhpc3RzTXNnZjI1IDwtIGxhcHBseShkZnNtc2dmLAogICAgICAgICAgICAgICAgICAgICAgZnVuY3Rpb24oZGIsIHNjb3JlLCBkZWNveSwgbG9nMTApIAogICAgICAgICAgICAgICAgICAgICAgICBldmFsVGFyZ2V0RGVjb3lzSGlzdCgKICAgICAgICAgICAgICAgICAgICAgICAgICBkYiAlPiUgZmlsdGVyKHJhbms9PTEpLCAKICAgICAgICAgICAgICAgICAgICAgICAgICBkZWNveSwgCiAgICAgICAgICAgICAgICAgICAgICAgICAgc2NvcmUsIAogICAgICAgICAgICAgICAgICAgICAgICAgIGxvZzEwKSArIAogICAgICAgICAgICAgICAgICAgICAgICB4bGFiKCJTY29yZSIpICsgCiAgICAgICAgICAgICAgICAgICAgICAgIGdndGl0bGUoTlVMTCkgKyAgIAogICAgICAgICAgICAgICAgICAgICAgICBnZW9tX2hpc3RvZ3JhbShiaW5zID0gMjUsIAogICAgICAgICAgICAgICAgICAgICAgICAgICAgICAgICAgICAgICBwb3NpdGlvbiA9ICJpZGVudGl0eSIsCiAgICAgICAgICAgICAgICAgICAgICAgICAgICAgICAgICAgICAgIGFscGhhID0gLjkpLCAKICAgICAgICAgICAgICAgICAgICAgIHNjb3JlID0gInNjb3JlIiwgCiAgICAgICAgICAgICAgICAgICAgICBkZWNveSA9ICJpc19kZWNveSIsIAogICAgICAgICAgICAgICAgICAgICAgbG9nMTAgPSBUUlVFKQoKICBzZXQuc2VlZCgxNTEyMykKICBkZiA8LSBkYXRhLmZyYW1lKAogICAgeHRoZW8gPSBjKAogICAgICBzYW1wbGUoCiAgICAgICAgc2VxKDAuNSwgMi4xLCBsZW5ndGggPSAzMCksIDEwKSwKICAgICAgcmVwKE5BLDUpCiAgICAgICksCiAgICB5MCA9IHJlcCgwLjgsIDE1KSwgCiAgICB5dGhlbyA9cmVwKDIuMiwgMTUpCiAgICApICU+JSAKICBtdXRhdGUoCiAgICAgIHhyZWFsID0gYyhzYW1wbGUoeHRoZW8sOCksIAogICAgICAgICAgICAgICAgc2FtcGxlKHNlcSgwLjcsIDIuMSwgbGVuZ3RoID0gMjApLAogICAgICAgICAgICAgICAgICAgICAgIDcpCiAgICAgICAgICAgICAgICApLAogICAgICB5cmVhbCA9IGMocnVuaWYoMTUsIC4xLCAxLjUpKQogICkKdGhlb1Bsb3QgPC0gZGYgJT4lCiAgZ2dwbG90KCkgKyAKICBhbm5vdGF0ZSgicmVjdCIsCiAgICAgICAgICAgeG1pbiA9IDAsCiAgICAgICAgICAgeG1heCA9IDIsCiAgICAgICAgICAgeW1pbiA9IDEsCiAgICAgICAgICAgeW1heCA9IDMsIAogICAgICAgICAgIGNvbCA9ICJibGFjayIsCiAgICAgICAgICAgZmlsbCA9ICJ3aGl0ZSIpICsgCiAgYW5ub3RhdGUoInJlY3QiLAogICAgICAgICAgIHhtaW4gPSAwLjIsCiAgICAgICAgICAgeG1heCA9IDIuMiwKICAgICAgICAgICB5bWluID0gLjgsCiAgICAgICAgICAgeW1heCA9IDIuOCwgCiAgICAgICAgICAgY29sID0gImJsYWNrIiwgCiAgICAgICAgICAgZmlsbCA9ICJ3aGl0ZSIpICsKICAgIGFubm90YXRlKCJyZWN0IiwKICAgICAgICAgICAgIHhtaW4gPSAwLjQsCiAgICAgICAgICAgICB4bWF4ID0gMi40LAogICAgICAgICAgICAgeW1pbiA9IC42LAogICAgICAgICAgICAgeW1heCA9IDIuNiwgCiAgICAgICAgICAgICBjb2wgPSAiYmxhY2siLAogICAgICAgICAgICAgZmlsbCA9ICJ3aGl0ZSIpICsKICAgICBhbm5vdGF0ZSgicmVjdCIsCiAgICAgICAgICAgICAgeG1pbiA9IDAsCiAgICAgICAgICAgICAgeG1heCA9IDIuMCwKICAgICAgICAgICAgICB5bWluID0gLTEuNiwKICAgICAgICAgICAgICB5bWF4ID0gMC40LCAKICAgICAgICAgICAgICBjb2wgPSAiYmxhY2siLAogICAgICAgICAgICAgIGZpbGwgPSAid2hpdGUiKSArCiAgIGFubm90YXRlKCJyZWN0IiwKICAgICAgICAgICAgeG1pbiA9IDAuMiwKICAgICAgICAgICAgeG1heCA9IDIuMiwKICAgICAgICAgICAgeW1pbiA9IC0xLjgsCiAgICAgICAgICAgIHltYXggPSAwLjIsIAogICAgICAgICAgICBjb2wgPSAiYmxhY2siLAogICAgICAgICAgICBmaWxsID0gIndoaXRlIikgKwogICBhbm5vdGF0ZSgicmVjdCIsCiAgICAgICAgICAgIHhtaW4gPSAwLjQsCiAgICAgICAgICAgIHhtYXggPSAyLjQsCiAgICAgICAgICAgIHltaW4gPSAtMiwKICAgICAgICAgICAgeW1heCA9IDAsIAogICAgICAgICAgICBjb2wgPSAiYmxhY2siLAogICAgICAgICAgICBmaWxsID0gIndoaXRlIikgKwogIGdlb21fc2VnbWVudChhZXMoeCA9IHh0aGVvLAogICAgICAgICAgICAgICAgICAgeGVuZCA9IHh0aGVvLAogICAgICAgICAgICAgICAgICAgeSA9IHkwLAogICAgICAgICAgICAgICAgICAgeWVuZCA9IHl0aGVvKSkgKwogIGFubm90YXRlKCJ0ZXh0IiwKICAgICAgICAgICB4ID0gMSwgCiAgICAgICAgICAgeT0zLjIsIAogICAgICAgICAgIGxhYmVsPSJEYXRhYmFzZSIpICsgCiAgYW5ub3RhdGUoInRleHQiLAogICAgICAgICAgIHggPSAxLjQsIAogICAgICAgICAgIHk9LTIuMiwgCiAgICAgICAgICAgbGFiZWwgPSAiTVMyIHNwZWN0cmEiKSArCiAgZ2VvbV9zZWdtZW50KGFlcygKICAgIHggPSB4cmVhbCwKICAgIHhlbmQgPSB4cmVhbCwKICAgIHkgPSB5MC0yLjYsCiAgICB5ZW5kID0geXJlYWwtMS44KSkgKwogIHRoZW1lKGF4aXMubGluZSA9IGVsZW1lbnRfYmxhbmsoKSwKICAgICAgICBheGlzLnRleHQueCA9IGVsZW1lbnRfYmxhbmsoKSwKICAgICAgICBheGlzLnRleHQueSA9IGVsZW1lbnRfYmxhbmsoKSwKICAgICAgICBheGlzLnRpY2tzID0gZWxlbWVudF9ibGFuaygpLAogICAgICAgIGF4aXMudGl0bGUueCA9IGVsZW1lbnRfYmxhbmsoKSwKICAgICAgICBheGlzLnRpdGxlLnkgPSBlbGVtZW50X2JsYW5rKCksCiAgICAgICAgbGVnZW5kLnBvc2l0aW9uID0gIm5vbmUiLAogICAgICAgIHBhbmVsLmJhY2tncm91bmQgPSBlbGVtZW50X2JsYW5rKCksCiAgICAgICAgcGFuZWwuYm9yZGVyID0gZWxlbWVudF9ibGFuaygpLAogICAgICAgIHBhbmVsLmdyaWQubWFqb3IgPSBlbGVtZW50X2JsYW5rKCksCiAgICAgICAgcGFuZWwuZ3JpZC5taW5vciA9IGVsZW1lbnRfYmxhbmsoKSwKICAgICAgICBwbG90LmJhY2tncm91bmQgPSBlbGVtZW50X2JsYW5rKCkpICsKICAgIGFubm90YXRlKCJzZWdtZW50IiwgCiAgICAgICAgICAgICB4ID0gMi44LAogICAgICAgICAgICAgeGVuZCA9IDMuOCwgCiAgICAgICAgICAgICB5ID0gMC4zLAogICAgICAgICAgICAgeWVuZCA9IDAuMywgCiAgICAgICAgICAgICBhcnJvdyA9IGFycm93KCkpICsKICAgIGFubm90YXRlKCJ0ZXh0IiwgCiAgICAgICAgICAgICB4ID0gMy4zLCAKICAgICAgICAgICAgIHkgPSAxLjMsIAogICAgICAgICAgICAgbGFiZWwgPSAiU2VhcmNoXG4gRW5naW5lIikgKwogICAgYW5ub3RhdGUoInRleHQiLCAKICAgICAgICAgICAgIHggPSAzLjMsIAogICAgICAgICAgICAgeSA9IC0uNSwgCiAgICAgICAgICAgICBsYWJlbCA9ICJUREEiKSAKICAgIAp0b2NQbG90IDwtIGdyaWRFeHRyYTo6Z3JpZC5hcnJhbmdlKAogICAgdGhlb1Bsb3QsCiAgICBoaXN0c01zZ2YyNVtbcHlyb0lkXV0gKwogICAgICAgIGdlb21faGlzdG9ncmFtKAogICAgICAgICAgYmlucyA9IDI1LCAKICAgICAgICAgIHBvc2l0aW9uID0gImlkZW50aXR5IiwKICAgICAgICAgIGFscGhhID0gLjkpICsKICAgICAgICBnZ3RpdGxlKCJWYWxpZCBUREEiKSArCiAgICAgICAgdGhlbWUoCiAgICAgICAgICAgIGxlZ2VuZC5wb3NpdGlvbiA9ICJub25lIiwgCiAgICAgICAgICAgIHBsb3QudGl0bGUgPSBlbGVtZW50X3RleHQoaGp1c3QgPSAwLjUpLCAKICAgICAgICAgICAgcGFuZWwuZ3JpZC5tYWpvciA9IGVsZW1lbnRfYmxhbmsoKSwgCiAgICAgICAgICAgIHBhbmVsLmdyaWQubWlub3IgPSBlbGVtZW50X2JsYW5rKCkKICAgICAgICAgICAgKSwKICAgIHBwUGxvdHNNc2dmW1tweXJvSWRdXSArIAogICAgICAgIGdndGl0bGUoTlVMTCkgKyAKICAgICAgICB4bGFiKCJGZCIpICsgCiAgICAgICAgeWxhYigiRnQiKSArCiAgICAgICAgeWxpbSgwLCAuNikgKyAKICAgICAgICBzY2FsZV94X2NvbnRpbnVvdXMoYnJlYWtzID0gYygwLCAwLjUsIDEuMCkpICsKICAgICAgICB0aGVtZSgKICAgICAgICAgICAgcGFuZWwuZ3JpZC5tYWpvciA9IGVsZW1lbnRfYmxhbmsoKSwgCiAgICAgICAgICAgIHBhbmVsLmdyaWQubWlub3IgPSBlbGVtZW50X2JsYW5rKCkKICAgICAgICAgICAgKSwKICAgIGhpc3RzVGFuZGVtMjVbW3JlZmluZUlkXV0gKyAKICAgICAgICAgZ2VvbV9oaXN0b2dyYW0oYmlucyA9IDI1LCAKICAgICAgICAgICAgICAgICAgICAgICAgcG9zaXRpb24gPSAiaWRlbnRpdHkiLAogICAgICAgICAgICAgICAgICAgICAgICBhbHBoYSA9IC45KSArCiAgICAgICAgc2NhbGVfZmlsbF9tYW51YWwoCiAgICAgICAgICAgIHZhbHVlcyA9IGMoYEZBTFNFYCA9ICIjMDA5OTAwIiwgCiAgICAgICAgICAgICAgICAgICAgICAgYFRSVUVgID0gIiNGRjk5MDAiKSwKICAgICAgICAgICAgbGFiZWxzPWMoIlRhcmdldCIsICJEZWNveSIpKSArCiAgICAgICAgeGxpbSgtNi4yLDM1KSArCiAgICAgICAgZ2d0aXRsZSgiSW52YWxpZCBUREEiKSArCiAgICAgICAgdGhlbWUoCiAgICAgICAgICAgIGxlZ2VuZC5wb3NpdGlvbiA9IGMoMC43NSwwLjYpLAogICAgICAgICAgICBsZWdlbmQudGl0bGUgPSBlbGVtZW50X2JsYW5rKCksIAogICAgICAgICAgICBwbG90LnRpdGxlID0gZWxlbWVudF90ZXh0KGhqdXN0ID0gMC41KSwgCiAgICAgICAgICAgIHBhbmVsLmdyaWQubWFqb3IgPSBlbGVtZW50X2JsYW5rKCksIAogICAgICAgICAgICBwYW5lbC5ncmlkLm1pbm9yID0gZWxlbWVudF9ibGFuaygpKSwKICAgIHBwUGxvdHNUYW5kZW1bW3JlZmluZUlkXV0gKyAKICAgICAgICBnZ3RpdGxlKE5VTEwpICsKICAgICAgICB5bGltKDAsIC42KSArIAogICAgICAgIHhsYWIoIkZkIikgKyAKICAgICAgICB5bGFiKCJGdCIpICsgCiAgICAgICAgc2NhbGVfeF9jb250aW51b3VzKGJyZWFrcyA9IGMoMCwgMC41LCAxLjApKSArCiAgICAgICAgdGhlbWUocGFuZWwuZ3JpZC5tYWpvciA9IGVsZW1lbnRfYmxhbmsoKSwgCiAgICAgICAgICAgICAgcGFuZWwuZ3JpZC5taW5vciA9IGVsZW1lbnRfYmxhbmsoKSksCiAgICBucm93ID0gMiwKICAgIG5jb2wgPSAzLCAKICAgIGxheW91dF9tYXRyaXggPSByYmluZChjKDEsIDIsIDQpLAogICAgICAgICAgICAgICAgICAgICAgICAgIGMoMSwgMywgNSkpCiAgICApCgp0b2NQbG90CgpnZ3NhdmUoIi4vZmlncy9maWdHcmFwaGljYWxBYnN0cmFjdC5wbmciLAogICAgICAgZGV2aWNlID0gInBuZyIsCiAgICAgICBwbG90ID0gdG9jUGxvdCwgCiAgICAgICB3aWR0aCA9IDcsCiAgICAgICBoZWlnaHQgPSAzLjkpCgpnZ3NhdmUoIi4vdGlmZnMvZmlnR3JhcGhpY2FsQWJzdHJhY3QudGlmZiIsCiAgICAgICBkZXZpY2UgPSJ0aWZmIiwKICAgICAgIHBsb3QgPSB0b2NQbG90LCAKICAgICAgIHdpZHRoID0gNywKICAgICAgIGhlaWdodCA9IDMuOSkKYGBgCiAKIyBDbGVhbiB1cCBmaWxlcwoKYGBge3J9CmYgPC0gbGlzdC5maWxlcygiLi9kYXRhIiwgcmVjdXJzaXZlID0gVFJVRSwgZnVsbC5uYW1lcyA9IFRSVUUpCmZpbGUucmVtb3ZlKGYpCmZpbGUucmVtb3ZlKCJkYXRhIikKZmlsZS5yZW1vdmUoZGVzdEZpbGUpCmBgYAoKCiMgU2Vzc2lvbiBJbmZvCgpgYGB7cn0Kc2Vzc2lvbkluZm8oKQpgYGAKCgoKCg==