---
title: "8.3 Experimental Design II: Randomized Complete Block Designs and Pseudo-replication"
author: "Lieven Clement"
subtitle: "statOmics, Ghent University (https://statomics.github.io)"
format:
html: default
pdf: default
---
<a rel="license" href="https://creativecommons.org/licenses/by-nc-sa/4.0"><img alt="Creative Commons License" style="border-width:0" src="https://i.creativecommons.org/l/by-nc-sa/4.0/88x31.png" /></a>
```{r}
library(tidyverse)
```
# Randomized complete block designs
$$\sigma^2= \sigma^2_{bio}+\sigma^2_\text{lab} +\sigma^2_\text{extraction} + \sigma^2_\text{run} + \ldots$$
- Biological: fluctuations in protein level between mice, fluctations in protein level between cells, ...
- Technical: cage effect, lab effect, week effect, plasma extraction, MS-run, ...
# Nature methods: Points of significance - Blocking
[https://www.nature.com/articles/nmeth.3005.pdf](https://www.nature.com/articles/nmeth.3005.pdf)
- Oneway anova is a special case of a completely randomized design:
- the experimental units are sampled at random from the population
- the treatments are randomized to the experimental units
- Every experimental unit receives one treatment and its response variable is measured once.
- In a block design the experimental units are blocks which are sampled at random of the population of all possible blocks.
- The RCB restricts randomization: the treatments are randomized within the blocks.
- it cannot be analysed using oneway anova.
- The paired design is a special case of an RCB: block size equals 2.
- Within block effects can be assessed using the lm function in R.
# Mouse example
## Background
```{r echo=FALSE, out.width="50%"}
knitr::include_graphics("https://raw.githubusercontent.com/statOmics/PSLS21/master/figures/mouseTcell_RCB_design.png")
```
Duguet et al. (2017) MCP 16(8):1416-1432. doi: 10.1074/mcp.m116.062745
- All treatments of interest are present within block!
- We can estimate the effect of the treatment within block!
We focus on one protein
- The measured intensities are already on the log2-scale. Differences between the intensities can thus be interpreted as log2 FC.
- P16045 or Galectin-1.
- Function: "Lectin that binds beta-galactoside and a wide array of complex carbohydrates. Plays a role in regulating apoptosis, cell proliferation and cell differentiation. Inhibits CD45 protein phosphatase activity and therefore the dephosphorylation of Lyn kinase. Strong inducer of T-cell apoptosis." (source: [uniprot](https://www.uniprot.org/uniprot/P16045))
## Data Exploration
```{r}
mouse <- read_tsv("https://raw.githubusercontent.com/statOmics/PSLSData/main/mouseP16045.txt")
mouse
```
```{r}
mouse |>
  ggplot(aes(x = mouse, y = intensity, col = celltype)) +
  geom_point()
```
```{r}
mouse |>
  ggplot(aes(x = celltype, y = intensity)) +
  geom_point() +
  geom_line(aes(group = mouse)) +
  geom_point(aes(col = celltype))
```
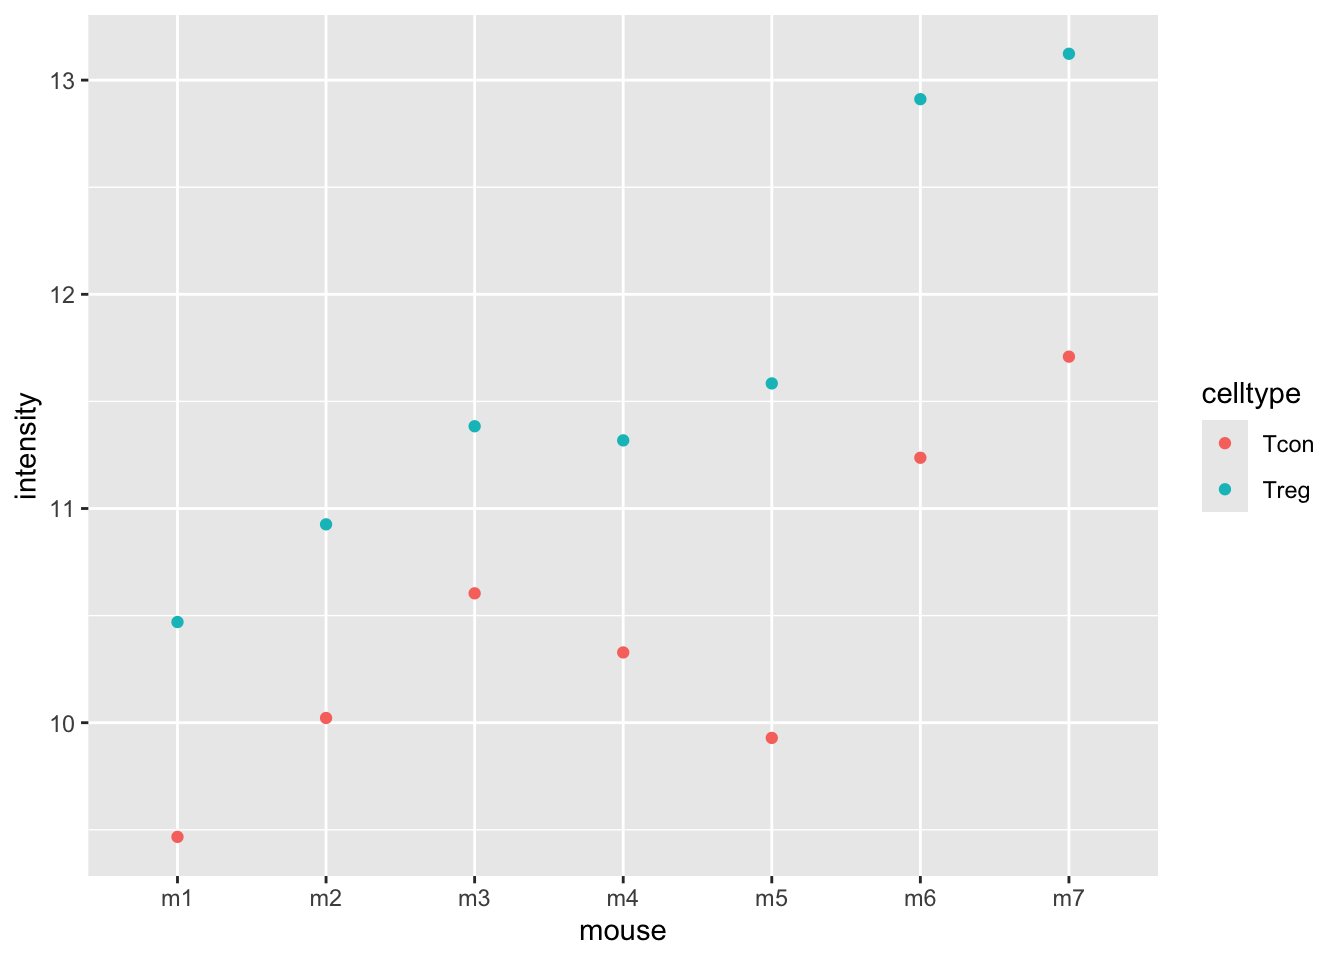
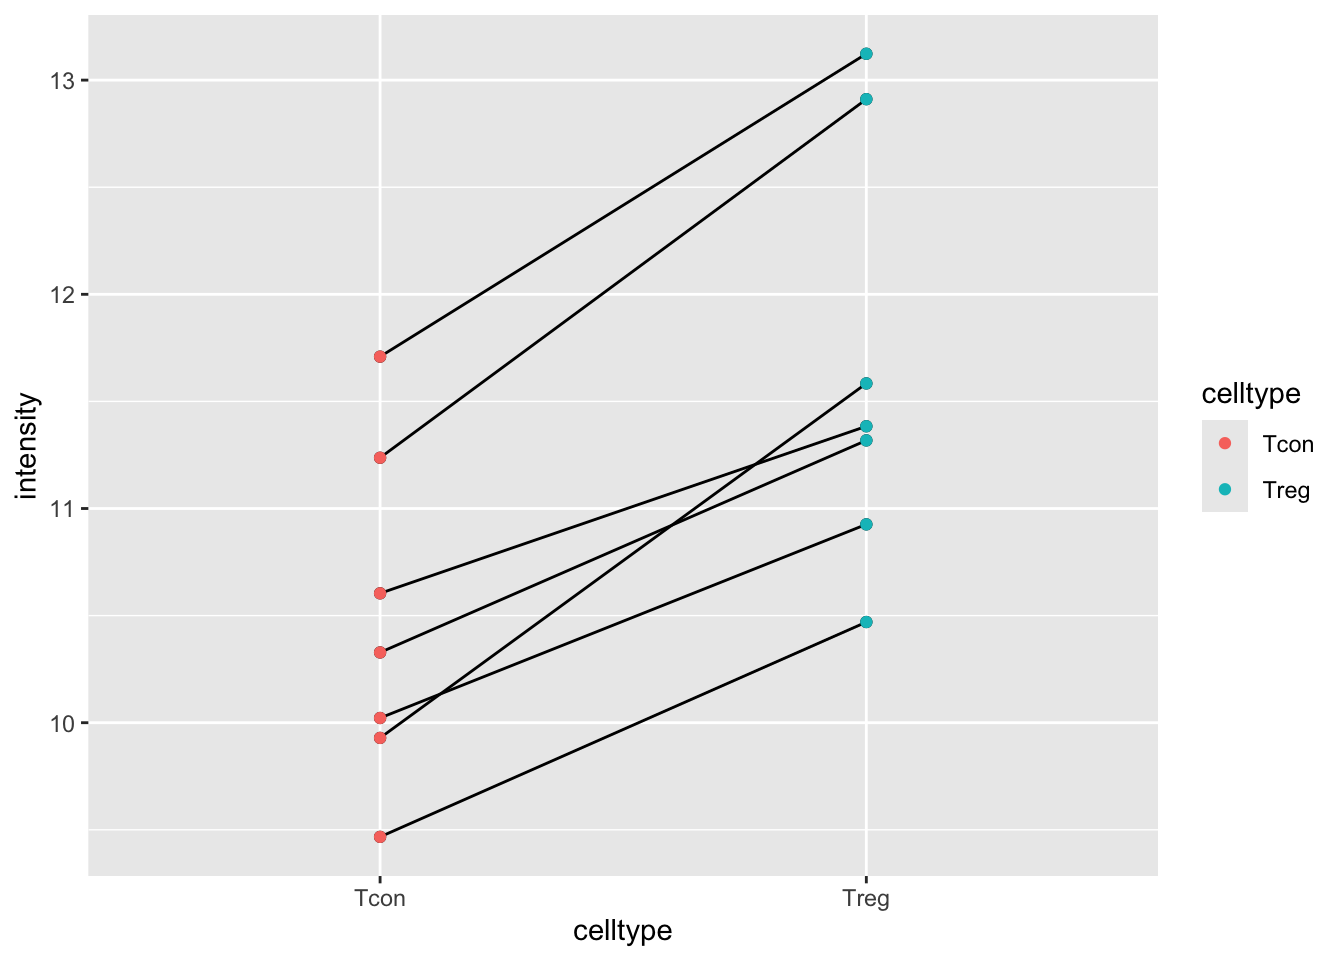
The plots show evidence for
- an upregulation of the protein expression in regulatory T-cells and
- a considerable variability in expression from animal to animal!
## Paired Analysis
This is a paired design, which is the most simple form of randomized complete block design.
In the introduction to statistical inference we would have analyzed the data by differencing.
```{r}
mouseWide <- mouse |>
  spread(celltype, intensity) |>
  mutate(delta = Treg - Tcon)
mouseWide
```
### Data exploration
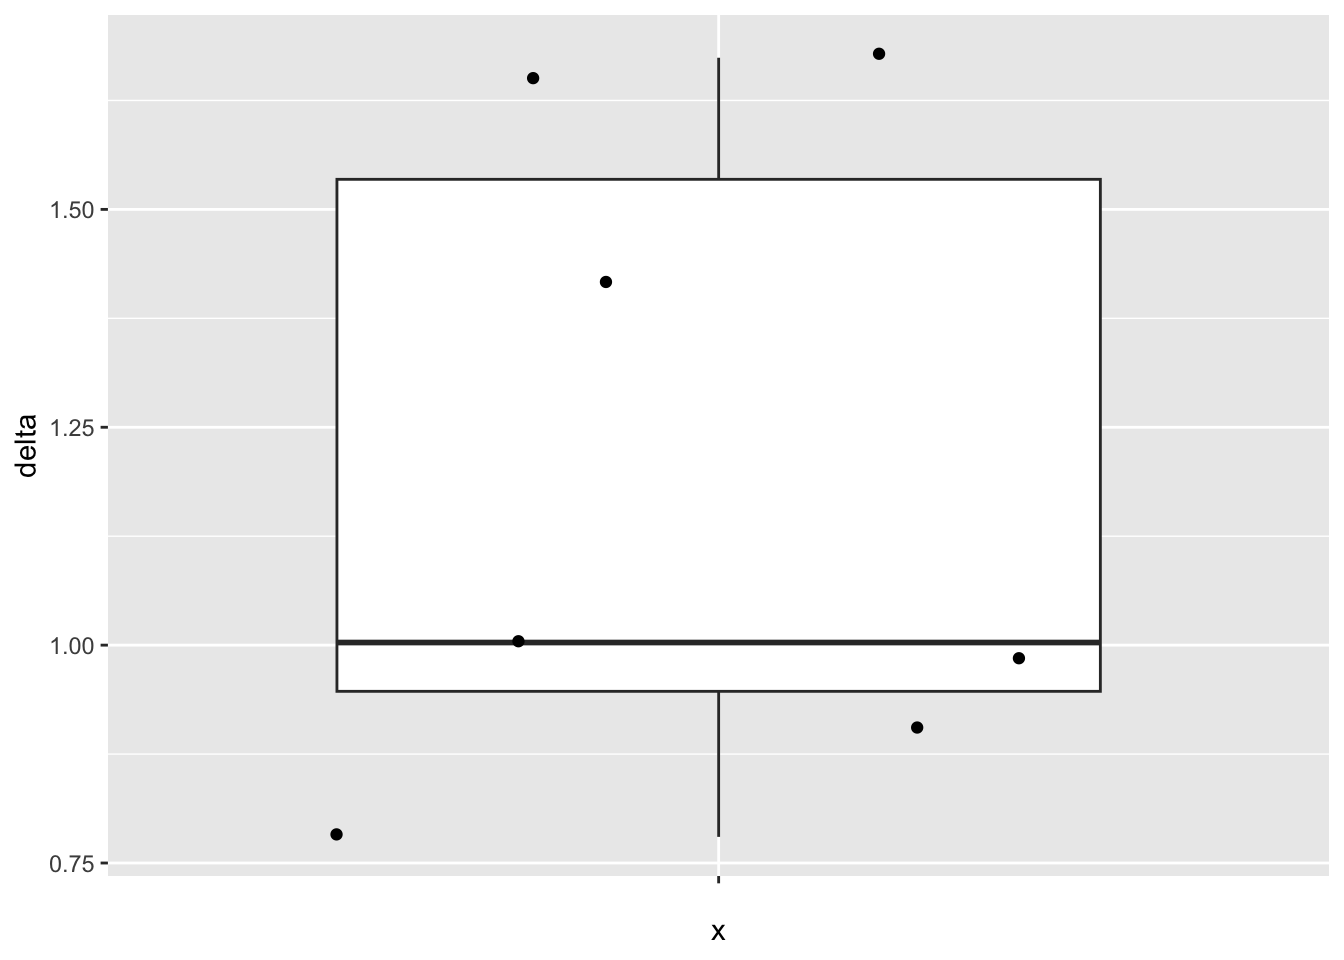
- Boxplot of difference
```{r}
mouseWide |>
  ggplot(aes(x = "", y = delta)) +
  geom_boxplot(outlier.shape = NA) +
  geom_jitter()
```
- Summary statistics
```{r}
deltaSum <- mouseWide |>
  summarize(
      mean = mean(delta, na.rm = TRUE),
      sd = sd(delta, na.rm = TRUE),
      n = n()
  ) |>
  mutate(se = sd / sqrt(n))
deltaSum
```
Note, that the intensity data are not independent because we measured the expression in regulatory and ordinary T-cells for every animal
- Covariance and correlation between expression in both celltypes
```{r}
cor(mouseWide[, c("Tcon", "Treg")])
var(mouseWide[, c("Tcon", "Treg")])
var(mouseWide[, c("Tcon", "Treg")]) |>
  diag() |>
  sqrt()
```
- There is indeed a large correlation between the expression of the protein in conventional and regulatory T-cells.
- Standard deviation of difference?
$$
\begin{array}{lcl}
\text{sd}_{x_r - x_c} &=& \sqrt{1^2\hat \sigma_r^2 + (-1)^2 \hat \sigma_c^2 + 2 \times 1
\times -1
\times \hat\sigma_{r,c}}\\
&=&\sqrt{\hat \sigma_r^2 + \hat \sigma_c^2 - 2 \times \hat\sigma_{r,c}}
\end{array}
$$
```{r}
sdDelta2 <- (c(-1, 1) %*% var(mouseWide[, c("Tcon", "Treg")]) %*% c(-1, 1)) |>
  sqrt()
sdDelta2
seDeltaBar <- sdDelta2 / sqrt(deltaSum$n)
seDeltaBar
deltaSum
```
- The standard deviation on the difference is much lower because of the strong correlation!
- Note, that the paired design enabled us to estimate the difference in log2-expression between the two cell types in every animal (log2 FC).
```{r}
t.test(delta~1, mouseWide)
```
## Randomized complete block analysis
We can also analyse the design using a linear model, i.e. with
- a main effect for cell type and
- a main effect for the block factor mouse
Because we have measured the two cell types in every mouse, we can thus estimate the average log2-intensity of the protein in the T-cells for each mouse.
```{r}
lmRCB <- lm(intensity ~ celltype + mouse, mouse)
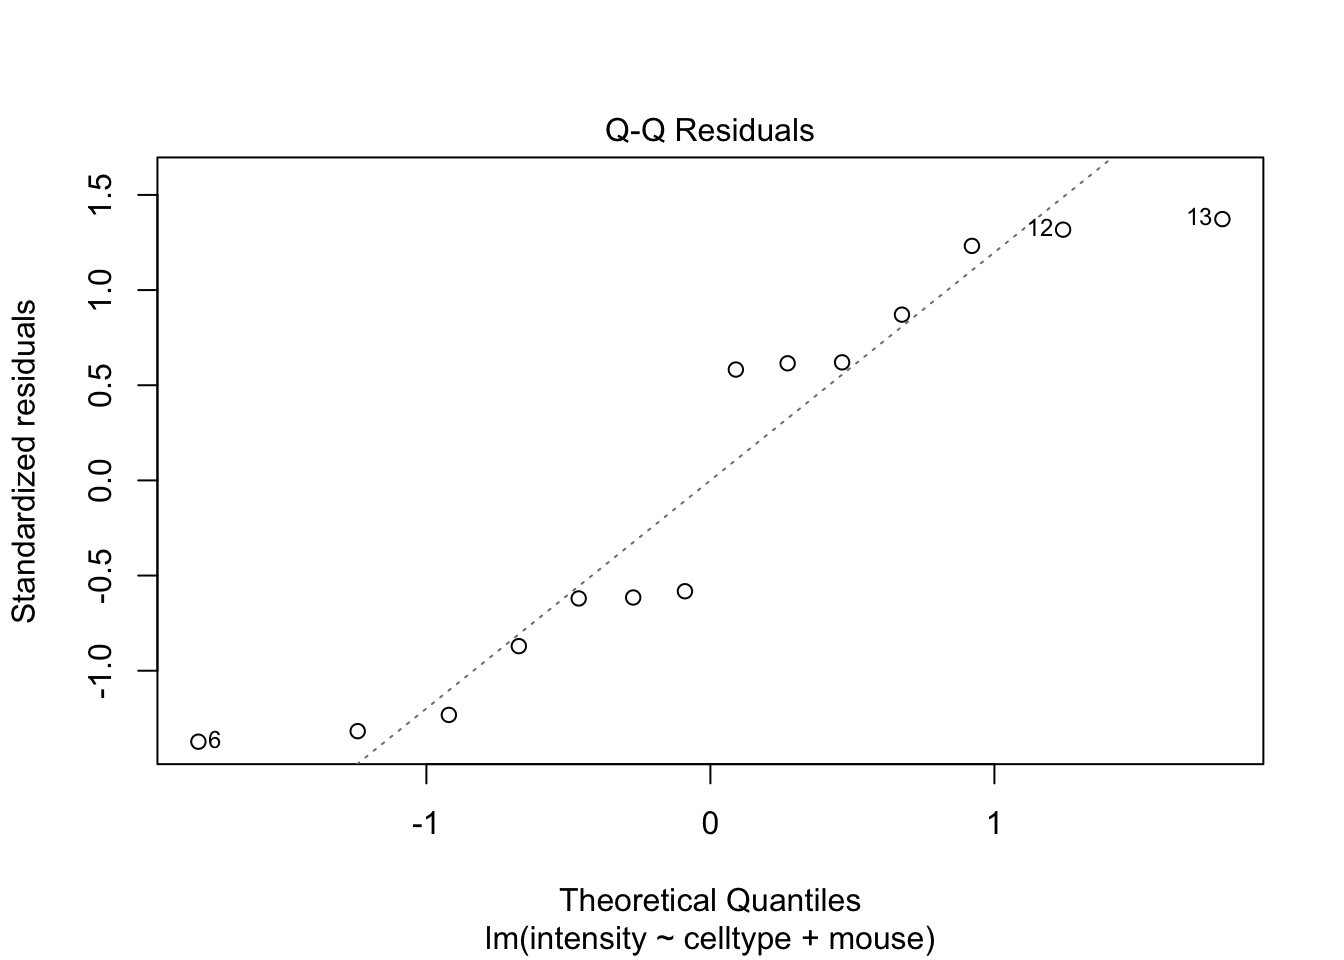
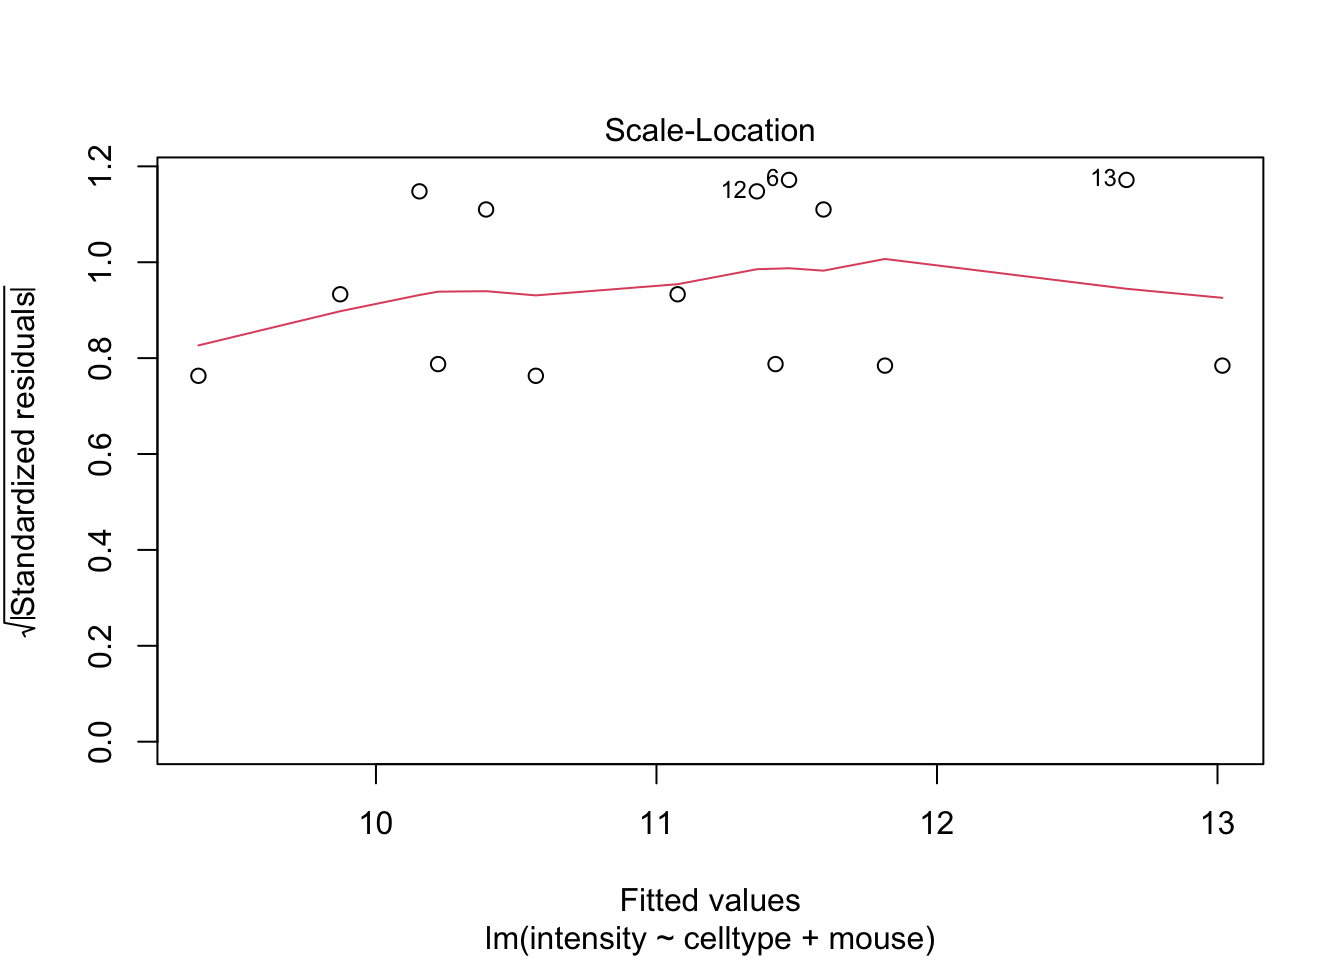
plot(lmRCB, which = c(1, 2, 3))
```
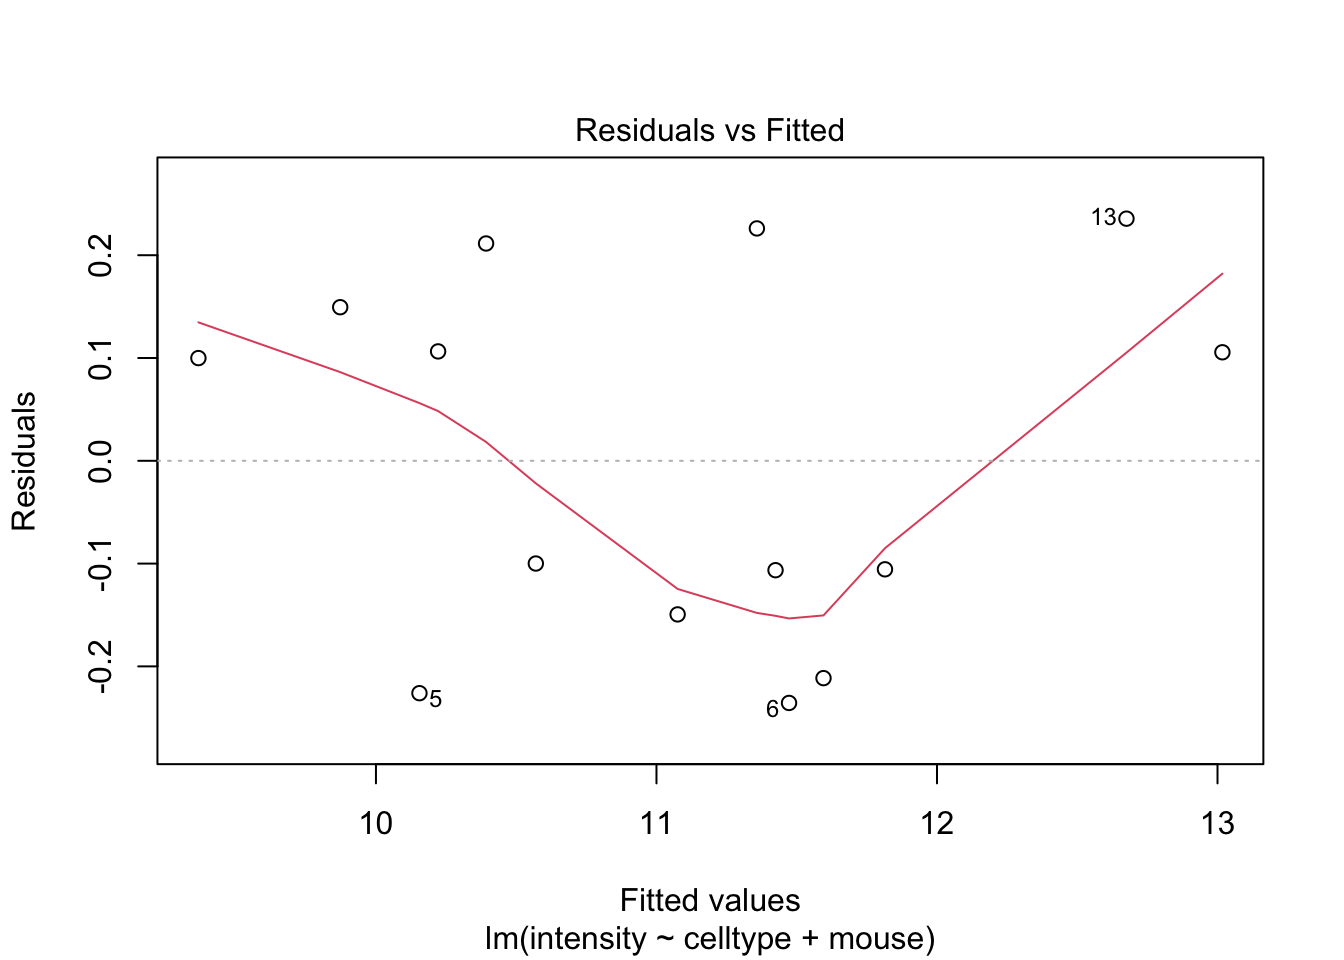
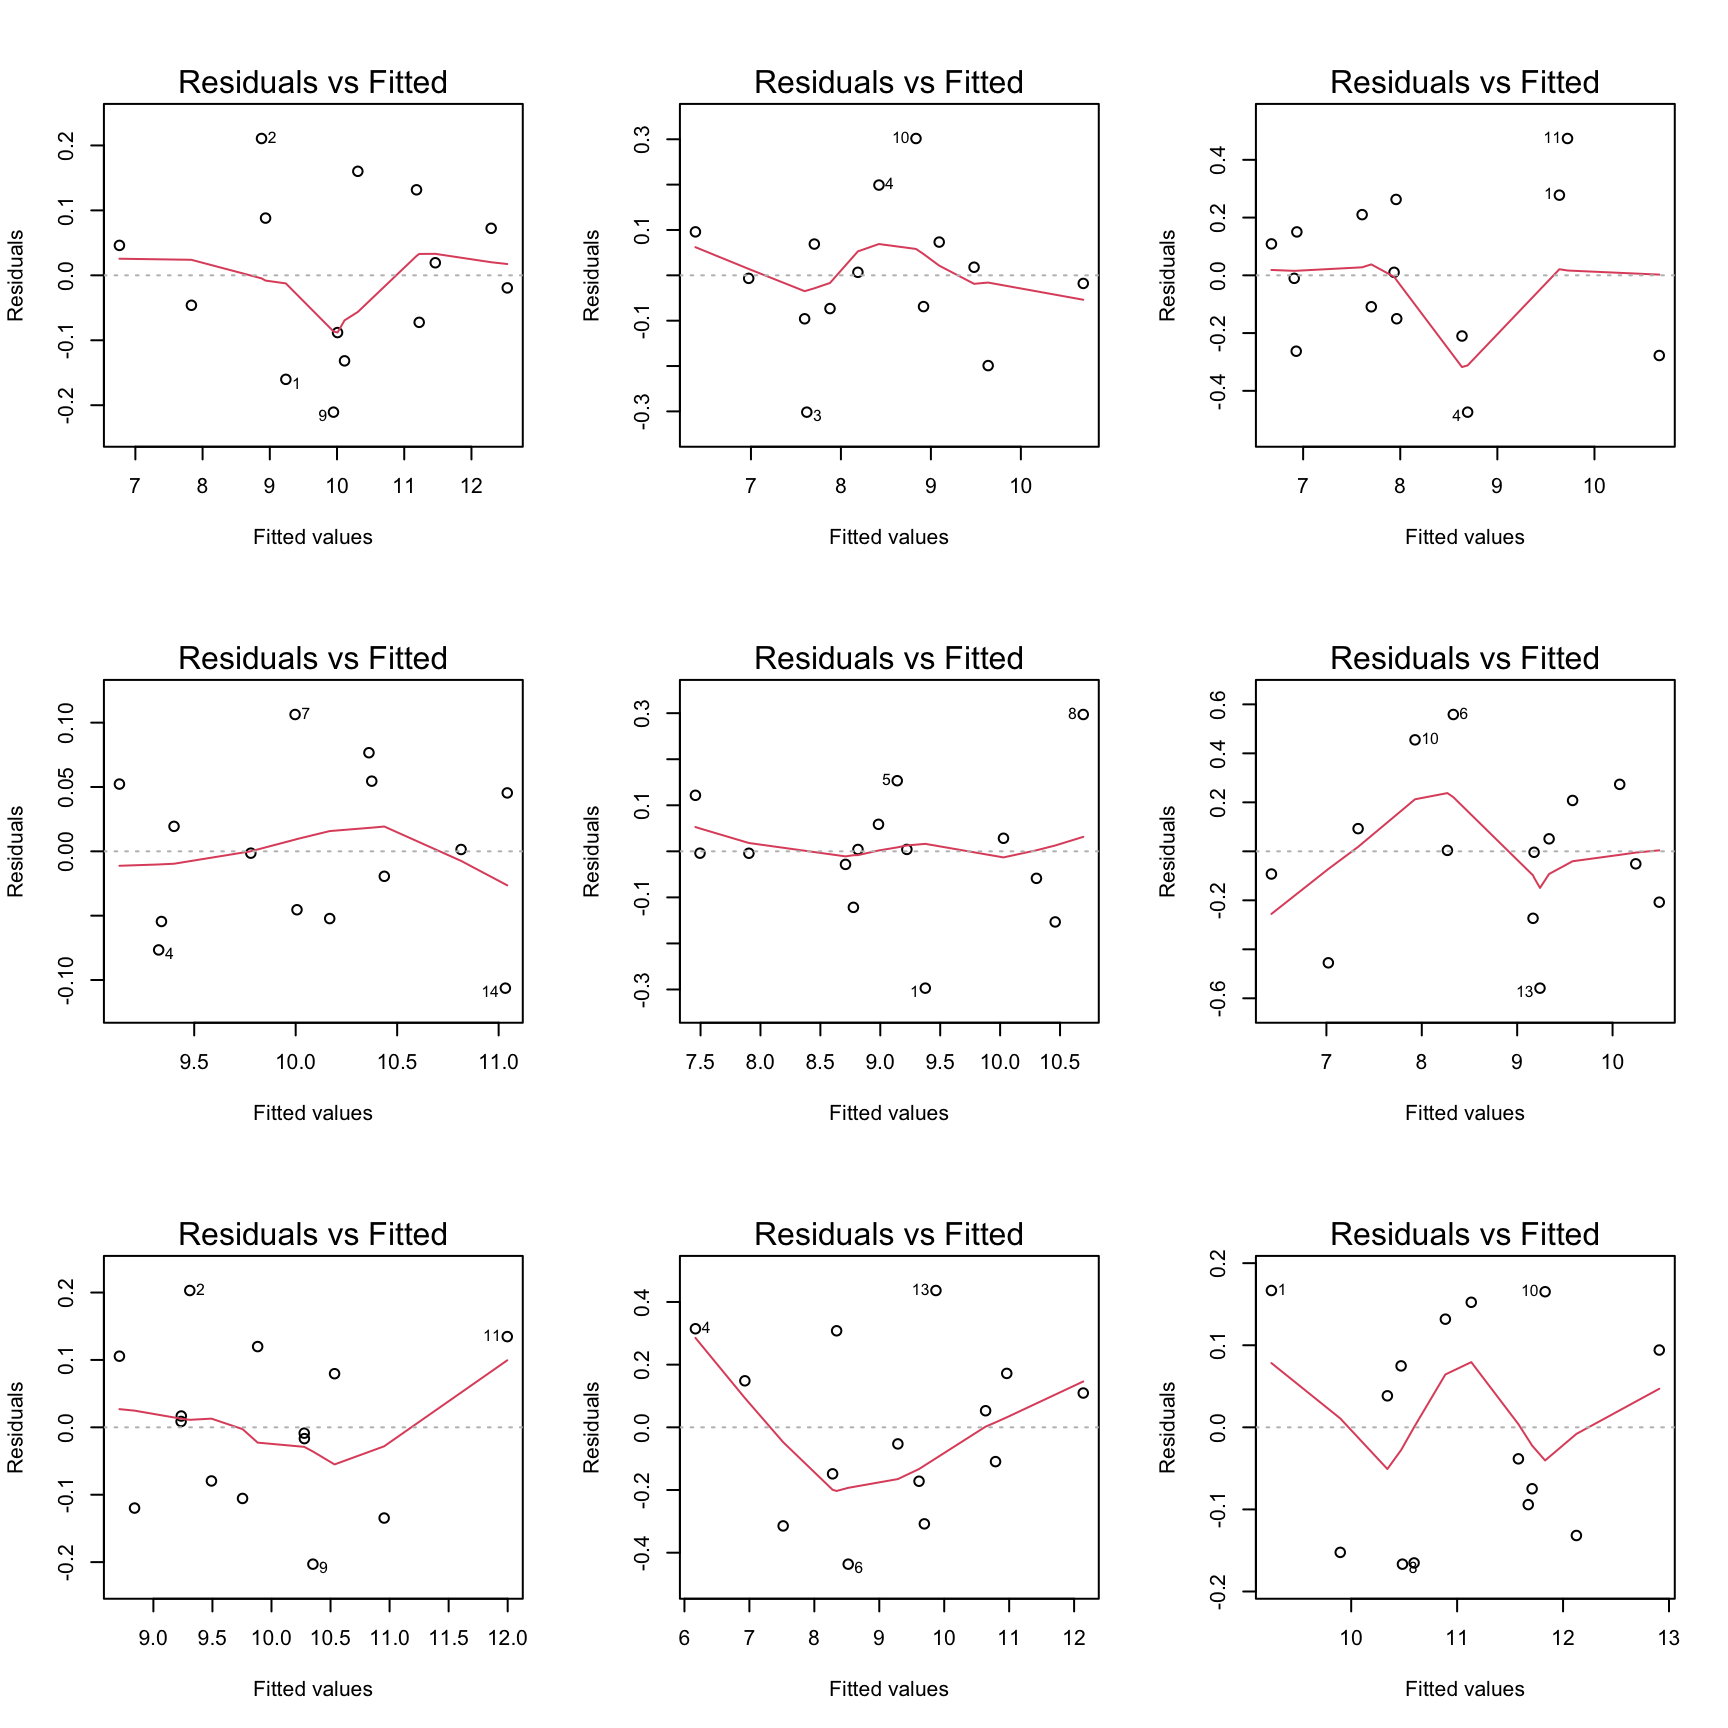
If you have doubts on that your data violates the assumptions you can always simulate data from a model with similar effects as yours but where are distributional assumptions hold and compare the residual plots.
```{r, fig.width=9, fig.height=9}
design <- model.matrix(intensity ~ celltype + mouse, mouse)
sigmaMouse <- sqrt(car::Anova(lmRCB, type = "III")["mouse", "Sum Sq"] / car::Anova(lmRCB, type = "III")["mouse", "Df"])
betas <- lmRCB$coefficients
nMouse <- mouse$mouse |>
  unique() |>
  length()

par(mfrow = c(3, 3))
for (i in 1:9)
{
  mouseEffect <- rnorm(nMouse, sd = sigmaMouse)
  betasMouse <- mouseEffect[-1] - mouseEffect[1]
  betas[-c(1:2)] <- betasMouse
  ysim <- design %*% betas + rnorm(nrow(design), sd = sigma(lmRCB))
  plot(lm(ysim ~ -1 + design), which = 1)
}
```
The deviations seen in our plot are in line with what those observed in simulations under the model assumptions.
Hence, we can use the model for statistical inference.
```{r}
anovaRCB <- car::Anova(lmRCB, type = "III")
summary(lmRCB)
t.test(delta ~1 , mouseWide)
anovaRCB
```
Notice that
1. the estimate, se, t-test statistic and p-value for the celltype effect of interest is the same as in the paired t-test!
2. the anova analysis shows that we model the total variability in the protein expression in T-cells using variability due to the cell type (CT), the variability from mouse to mouse (M) and residual variability (R) within mouse that we cannot explain. Indeed,
$$
\begin{array}{lcl}
\text{SSTot} &=& \text{SSCT} + \text{SSM} + \text{SSE}\\
`r round(anovaRCB[-1,"Sum Sq"] |> sum(),1)` &=& `r round(anovaRCB["celltype","Sum Sq"],1)` + `r round(anovaRCB["mouse","Sum Sq"],1)` + `r round(anovaRCB["Residuals","Sum Sq"],1)`
\end{array}
$$
So the celltype and the mouse effect explain respectively
$$
\begin{array}{ll}
\frac{\text{SSCT}}{\text{SSTot}}\times 100&\frac{\text{SSM}}{\text{SSTot}}\times 100\\\\
`r round(anovaRCB["celltype","Sum Sq"]/sum(anovaRCB[-1,"Sum Sq"])*100,1)`&
`r round(anovaRCB["mouse","Sum Sq"]/sum(anovaRCB[-1,"Sum Sq"])*100,1)`\\
\end{array}
$$
percent of the variability in the protein expression values and
$$
\frac{\text{SSE}}{\text{SSTot}} \times 100 = `r round(anovaRCB["Residuals","Sum Sq"]/sum(anovaRCB[-1,"Sum Sq"])*100,1)`
$$
percent cannot be explained.
Note, that
- the variability from mouse to mouse is the largest source of variability in the model,
- This variability can be estimated with the RCB design and
- can thus be isolated from the residual variability
- leading to a much higher precision on the estimate of the average log2 FC between regulatory and conventional T-cells that what would be obtained with a CRD!
Note, that the RCB also has to sacrifice a number of degrees of freedom to estimate the mouse effect, here 6 DF.
Hence, the power gain of the RCB is a trade-off between the variability that can be explained by the block effect and the loss in DF.
<!--
If you remember the equation of variance covariance matrix of the parameter estimators
$$
\hat{\boldsymbol{\Sigma}}^2_{\hat{\boldsymbol{\beta}}}
=\left(\mathbf{X}^T\mathbf{X}\right)^{-1}\hat\sigma^2
$$
you can see that the randomized complete block will have an impact on
- $\left(\mathbf{X}^T\mathbf{X}\right)^{-1}$ as well as
- on $\sigma^2$ of the residuals!
-->
$\rightarrow$ We were able to isolate the variance in expression between animals/blocks from our analysis!
$\rightarrow$ This reduces the variance of the residuals and leads to a power gain if the variability between mice/blocks is large.
Also note that,
$$
\hat\sigma^2 = \frac{\text{SSE}}{n-p} = \frac{SSTot - SSM - SSCT}{n-p}
$$
- Hence, blocking is beneficial if the reduction in sum of squares of the residuals is large compared to the degrees of freedom that are sacrificed.
- Thus if SSM can explain a large part of the total variability.
Further, the degrees of freedom affect the t-distribution that is used for inference, which has broader tails if the residual degrees of freedom $n-p$ are getting smaller.
# Power gain of an RCB vs CRD
In this section we will subset the original data in two experiments:
- A randomized complete block design with three mice
- A completely randomized design with six mice but where we only measure one cell type in each mouse.
```{r}
set.seed(859)
mRcb <- mouse |>
  pull(mouse) |>
  unique() |>
  sample(size = 3)

rcbSmall <- mouse |> filter(mouse %in% mRcb)
rcbSmall
```
```{r}
mCrd <- mouse |>
  pull(mouse) |>
  unique() |>
  sample(size = 6)


crdSmall <-
  bind_rows(
    mouse |>
      filter(mouse %in% mCrd[1:3]) |>
      filter(celltype == "Tcon"),
    mouse |>
      filter(mouse %in% mCrd[-(1:3)]) |>
      filter(celltype == "Treg")
  )
crdSmall
```
So in both experiments we need to do six mass spectrometry runs.
```{r}
lmCRDSmall <- lm(intensity ~ celltype, crdSmall)
summary(lmCRDSmall)
anova(lmCRDSmall)
```
```{r}
lmRCBSmall <- lm(intensity ~ celltype + mouse, rcbSmall)
anova(lmRCBSmall)
summary(lmRCBSmall)
```
Note, that
- we are able to pick up the upregulation between regulatory T-cells and ordinary T-cells with the RCB but not with the CRD.
- the standard error of the $\log_2\text{FC}_\text{Treg-Tcon}$ estimate is a factor `r round(summary(lmCRDSmall)$coef["celltypeTreg","Std. Error"]/summary(lmRCBSmall)$coef["celltypeTreg","Std. Error"],1)` smaller for the RCB design!
A poor data analysis who forgets about the blocking will be back at square one:
```{r}
wrongRbc <- lm(intensity ~ celltype, rcbSmall)
anova(wrongRbc)
summary(wrongRbc)
```
So, the block to block variability is then absorbed in the variance estimator of the residual.
Of course, we are never allowed to analyse an RCB with a model for a CRD (without block factor) because blocking imposes a randomization restriction: we randomize the treatment within block.
## Power gain of blocking?
### Power for completely randomized design
```{r}
varBetweenPlusWithin <- sum(car::Anova(lmRCB, type = "III")[c("mouse", "Residuals"), "Sum Sq"]) / sum(car::Anova(lmRCB, type = "III")[c("mouse", "Residuals"), "Df"])

alpha <- 0.05
nSim <- 20000
b0 <- 0
sd <- sqrt(varBetweenPlusWithin)
ns <- c(3, 7)
deltas <- lmRCB$coefficients["celltypeTreg"]

L <- limma::makeContrasts("celltypeTreg", levels = c("(Intercept)", "celltypeTreg"))
powerFast <- matrix(NA, nrow = length(ns) * length(deltas), ncol = 3) |> as.data.frame()
names(powerFast) <- c("b1", "n", "power")

i <- 0
for (n in ns)
{
  n1 <- n2 <- n

  ### Simulation
  predictorData <- data.frame(celltype = rep(c("Tcon", "Treg"), c(n1, n2)) |> as.factor())
  design <- model.matrix(~celltype, predictorData)

  for (b1 in deltas)
  {
    ySim <- rnorm(nrow(predictorData) * nSim, sd = sd)
    dim(ySim) <- c(nrow(predictorData), nSim)
    ySim <- ySim + c(design %*% c(b0, b1))
    ySim <- t(ySim)

    ### Fitting
    fitAll <- limma::lmFit(ySim, design)

    ### Inference
    varUnscaled <- c(t(L) %*% fitAll$cov.coefficients %*% L)
    contrasts <- fitAll$coefficients %*% L
    seContrasts <- varUnscaled^.5 * fitAll$sigma
    tstats <- contrasts / seContrasts
    pvals <- pt(abs(tstats), fitAll$df.residual, lower.tail = FALSE) * 2

    i <- i + 1
    powerFast[i, ] <- c(b1, n, mean(pvals < alpha))
  }
}
powerFast
```
Because we have a simple 2 group comparison we can also calculate the power using the `power.t.test` function.
```{r}
power.t.test(n = 3, delta = lmRCB$coefficients["celltypeTreg"], sd = sqrt(varBetweenPlusWithin))
power.t.test(n = 7, delta = lmRCB$coefficients["celltypeTreg"], sd = sqrt(varBetweenPlusWithin))
```
## Power for randomized complete block design
```{r}
alpha <- 0.05
nSim <- 20000
b0 <- 0
sd <- sigma(lmRCB)
sdMouse <- sqrt(car::Anova(lmRCB)["mouse", "Sum Sq"] / car::Anova(lmRCB)["mouse", "Df"])
ns <- c(3, 7)
deltas <- lmRCB$coefficients["celltypeTreg"]


powerFastBlocking <- matrix(NA, nrow = length(ns) * length(deltas), ncol = 3) |> as.data.frame()
names(powerFastBlocking) <- c("b1", "n", "power")

i <- 0
for (n in ns)
{

  ### Simulation
  predictorData <- data.frame(celltype = rep(c("Tcon", "Treg"), each = n) |> as.factor(), mouse = paste0("m", rep(1:n, 2)))
  design <- model.matrix(~ celltype + mouse, predictorData)
  L <- limma::makeContrasts("celltypeTreg", levels = colnames(design))

  for (b1 in deltas)
  {
    ySim <- rnorm(nrow(predictorData) * nSim, sd = sd)
    dim(ySim) <- c(nrow(predictorData), nSim)
    mouseEffect <- rnorm(n, sd = sdMouse)
    betasMouse <- mouseEffect[-1] - mouseEffect[1]
    ySim <- ySim + c(design %*% c(b0, b1, betasMouse))
    ySim <- t(ySim)

    ### Fitting
    fitAll <- limma::lmFit(ySim, design)

    ### Inference
    varUnscaled <- c(t(L) %*% fitAll$cov.coefficients %*% L)
    contrasts <- fitAll$coefficients %*% L
    seContrasts <- varUnscaled^.5 * fitAll$sigma
    tstats <- contrasts / seContrasts
    pvals <- pt(abs(tstats), fitAll$df.residual, lower.tail = FALSE) * 2

    i <- i + 1
    powerFastBlocking[i, ] <- c(b1, n, mean(pvals < alpha))
  }
}
powerFastBlocking
```
Note, that the power is indeed much larger for the randomized complete block design.
Both for the designs with 6 and 14 mass spectrometer runs.
Because we have an RCB with a block size of 2 (paired design) we can also calculate the power using the `power.t.test function` with `type = "one.sample"` and `sd` equal to the standard deviation of the difference.
```{r}
power.t.test(n = 3, delta = mean(mouseWide$delta), sd = sd(mouseWide$delta))
power.t.test(n = 7, delta = mean(mouseWide$delta), sd = sd(mouseWide$delta))
```
Note, that the power is slightly different because for the power.t.test function we conditioned on the mice from our study. While in the simulation study we generated data for new mice by simulating the mouse effect from a normal distribution.
## Impact of the amount of variability that the blocking factor explains on the power?
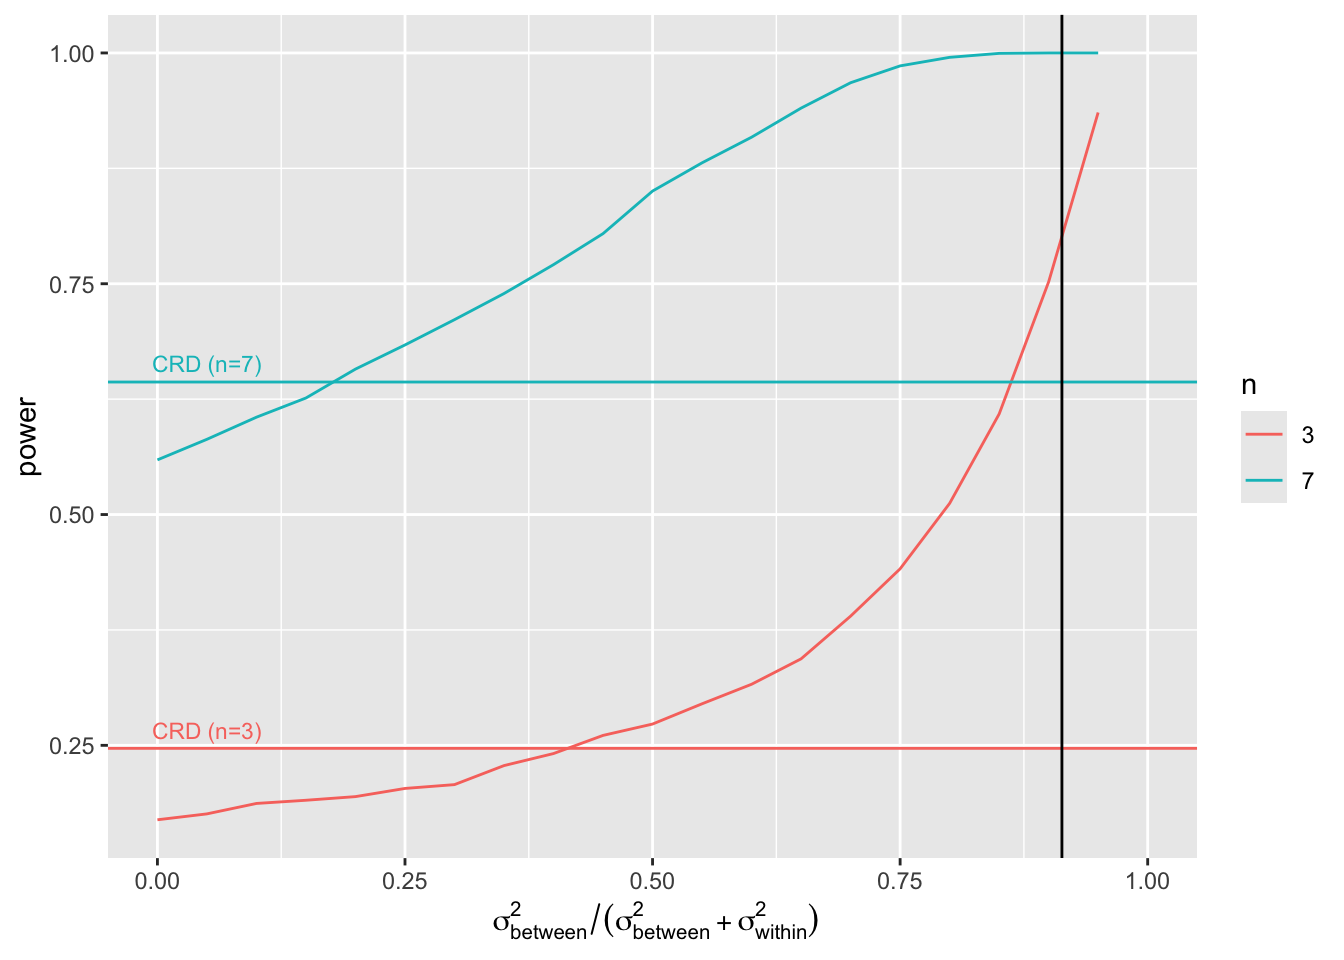
We will vary the block effect explains
$$
\frac{\sigma^2_\text{between}}{\sigma^2_\text{between}+\sigma^2_\text{within}}=1-\frac{\sigma^2_\text{within}}{\sigma^2_\text{between}+\sigma^2_\text{within}}
$$
So in our example that is the ratio between the variability between the mice and the sum of the variability between and within the mice. Note, that the within mouse variability was the variance of the errors of the RCB. The ratio for our experiment equals
```{r}
varBetweenPlusWithin <- sum(car::Anova(lmRCB, type = "III")[c("mouse", "Residuals"), "Sum Sq"]) / sum(car::Anova(lmRCB, type = "III")[c("mouse", "Residuals"), "Df"])
varWithin <- car::Anova(lmRCB)["Residuals", "Sum Sq"] / car::Anova(lmRCB)["Residuals", "Df"]
varBetweenPlusWithin
varWithin
1 - varWithin / varBetweenPlusWithin
```
```{r}
alpha <- 0.05
nSim <- 20000
b0 <- 0
varBetweenPlusWithin <- sum(car::Anova(lmRCB, type = "III")[c("mouse", "Residuals"), "Sum Sq"]) / sum(car::Anova(lmRCB, type = "III")[c("mouse", "Residuals"), "Df"])


ns <- c(3, 7)
deltas <- lmRCB$coefficients["celltypeTreg"]

fracVars <- seq(0, .95, .05)

powerFastBlockingLow <- matrix(NA, nrow = length(ns) * length(fracVars), ncol = 3) |> as.data.frame()
names(powerFastBlockingLow) <- c("fracVars", "n", "power")

i <- 0


for (n in ns)
{

  ### Simulation
  predictorData <- data.frame(celltype = rep(c("Tcon", "Treg"), each = n) |> as.factor(), mouse = paste0("m", rep(1:n, 2)))
  design <- model.matrix(~ celltype + mouse, predictorData)
  L <- limma::makeContrasts("celltypeTreg", levels = colnames(design))
  for (fracVar in fracVars)
  {
    sd <- sqrt(varBetweenPlusWithin * (1 - fracVar))
    sdMouse <- sqrt(varBetweenPlusWithin * fracVar)
    for (b1 in deltas)
    {
      ySim <- rnorm(nrow(predictorData) * nSim, sd = sd)
      dim(ySim) <- c(nrow(predictorData), nSim)
      mouseEffect <- rnorm(n, sd = sdMouse)
      betasMouse <- mouseEffect[-1] - mouseEffect[1]
      ySim <- ySim + c(design %*% c(b0, b1, betasMouse))
      ySim <- t(ySim)

      ### Fitting
      fitAll <- limma::lmFit(ySim, design)

      ### Inference
      varUnscaled <- c(t(L) %*% fitAll$cov.coefficients %*% L)
      contrasts <- fitAll$coefficients %*% L
      seContrasts <- varUnscaled^.5 * fitAll$sigma
      tstats <- contrasts / seContrasts
      pvals <- pt(abs(tstats), fitAll$df.residual, lower.tail = FALSE) * 2

      i <- i + 1
      powerFastBlockingLow[i, ] <- c(fracVar, n, mean(pvals < alpha))
    }
  }
}
powerFastBlockingLow
```
```{r}
gg_color_hue <- function(n) {
  hues <- seq(15, 375, length = n + 1)
  hcl(h = hues, l = 65, c = 100)[1:n]
}
cols <- gg_color_hue(2)

powerFastBlockingLow |>
  as.data.frame() |>
  mutate(n = as.factor(n)) |>
  ggplot(aes(fracVars, power, group = n, color = n)) +
  geom_line() +
  geom_hline(yintercept = powerFast |> filter(n == 3) |> pull(power), color = cols[1]) +
  annotate("text",
    label = "CRD (n=3)",
    x = 0.05, y = powerFast |> filter(n == 3) |> pull(power) + .02, size = 3, colour = cols[1]
  ) +
  geom_hline(yintercept = powerFast |> filter(n == 7) |> pull(power), color = cols[2]) +
  annotate("text",
    label = "CRD (n=7)",
    x = 0.05, y = powerFast |> filter(n == 7) |> pull(power) + .02, size = 3, colour = cols[2]
  ) +
  xlab(expression(~ sigma[between]^2 / (sigma[between]^2 + sigma[within]^2))) +
  geom_vline(xintercept = 1 - varWithin / varBetweenPlusWithin) +
  xlim(0, 1)
```
- So if the variance that is explained by the block effect is small you will loose power as compared to the analysis with a CRD design. Indeed, then
- SSE does not reduce much and
- n$_\text{blocks}$-1 degrees of freedom have been sacrificed.
- As soon as the block effect explains a large part of the variability it is very beneficial to use a randomized complete block design!
- Note, that the same number of mass spectrometry runs have to be done for both the RCB and CRD design. However, for the RCB we only need half of the mice.
# Penicillin example
The production of penicillin corn steep liquor is used. Corn steep liquor is produced in blends and there is a considerable variability between the blends. Suppose that
- four competing methods have to be evaluated to produce penicillin (A-D),
- one blends is sufficient for four runs of a penicillin batch reactor and
- the 20 runs can be scheduled for the experiment.
How would you assign the methods to the blends.
```{r}
data(penicillin, package = "faraway")
table(penicillin$blend, penicillin$treat)
```
## Data
```{r}
head(penicillin)
matrix(penicillin$yield, nrow = 5, ncol = 4, byrow = TRUE, dimnames = list(levels(penicillin$blend), levels(penicillin$treat)))
```
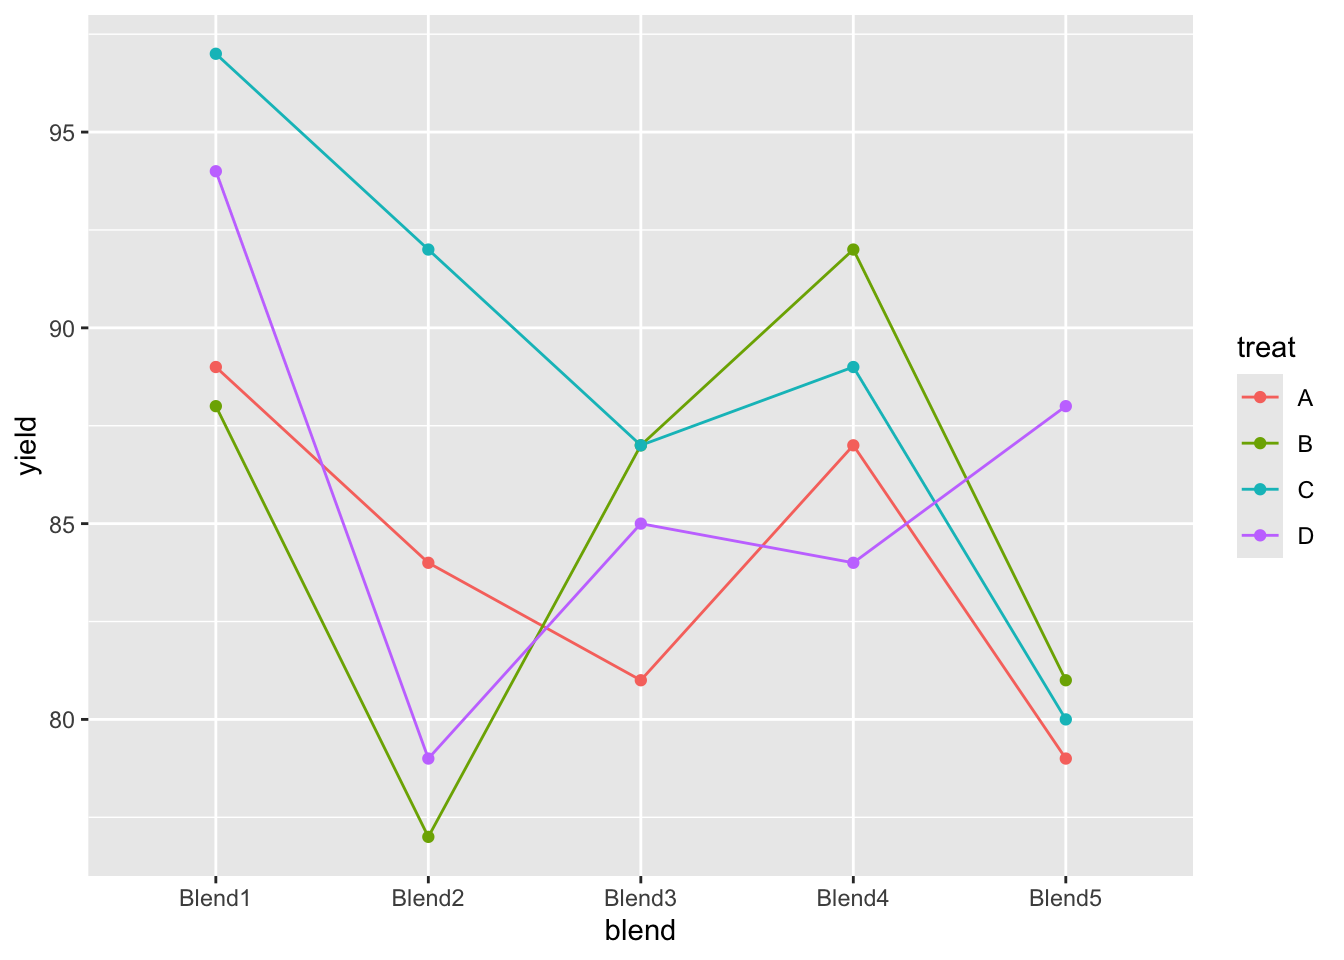
```{r}
penicillin |>
  ggplot(aes(x = blend, y = yield, group = treat, color = treat)) +
  geom_line() +
  geom_point()
```
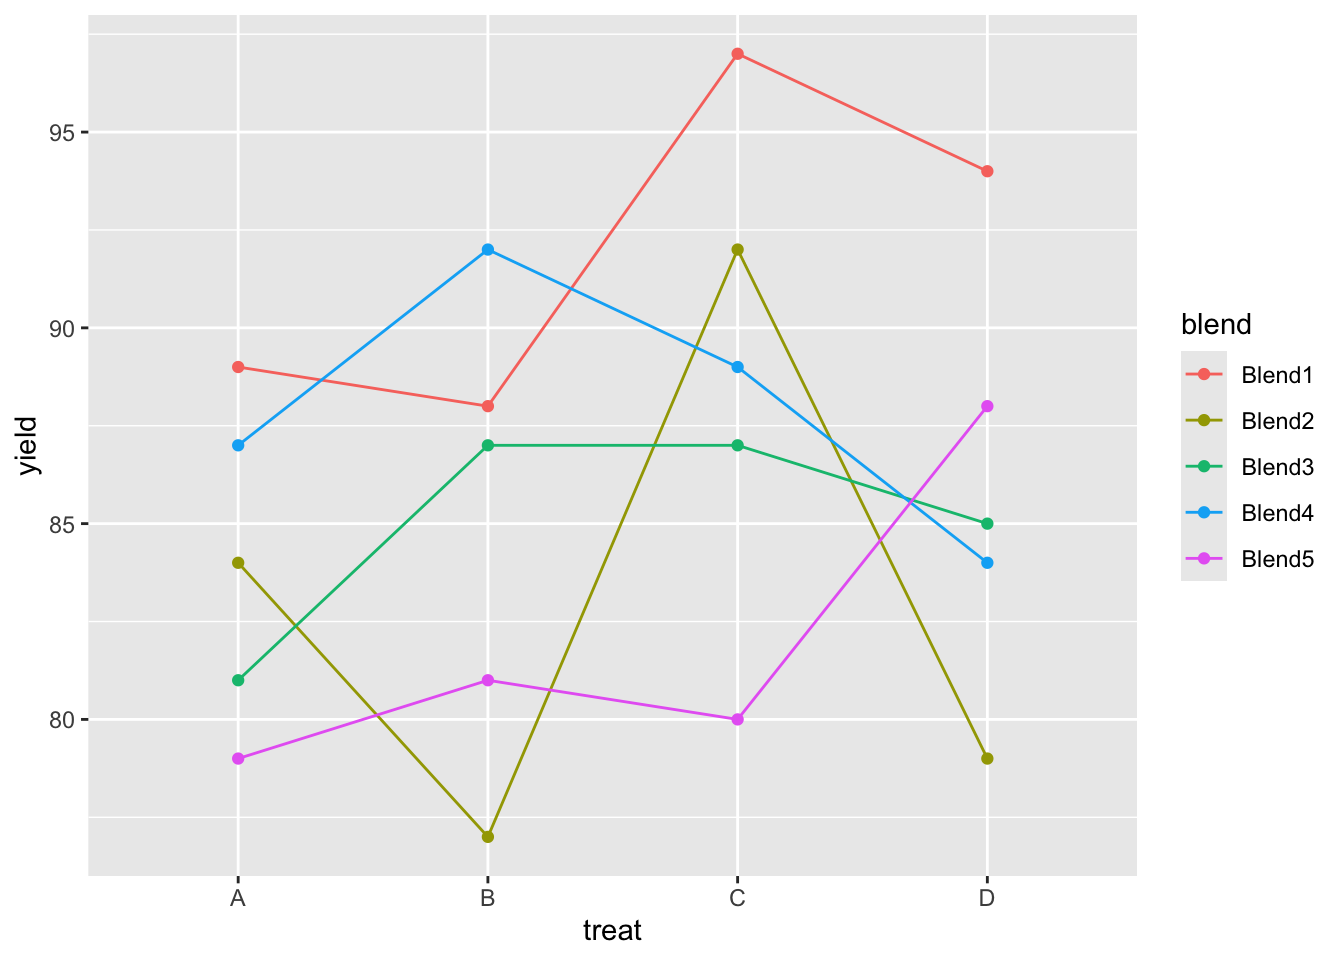
```{r}
penicillin |>
  ggplot(aes(x = treat, y = yield, group = blend, color = blend)) +
  geom_line() +
  geom_point()
```
## Analysis
We analyse the yield using
- a factor for blend and
- a factor for treatment.
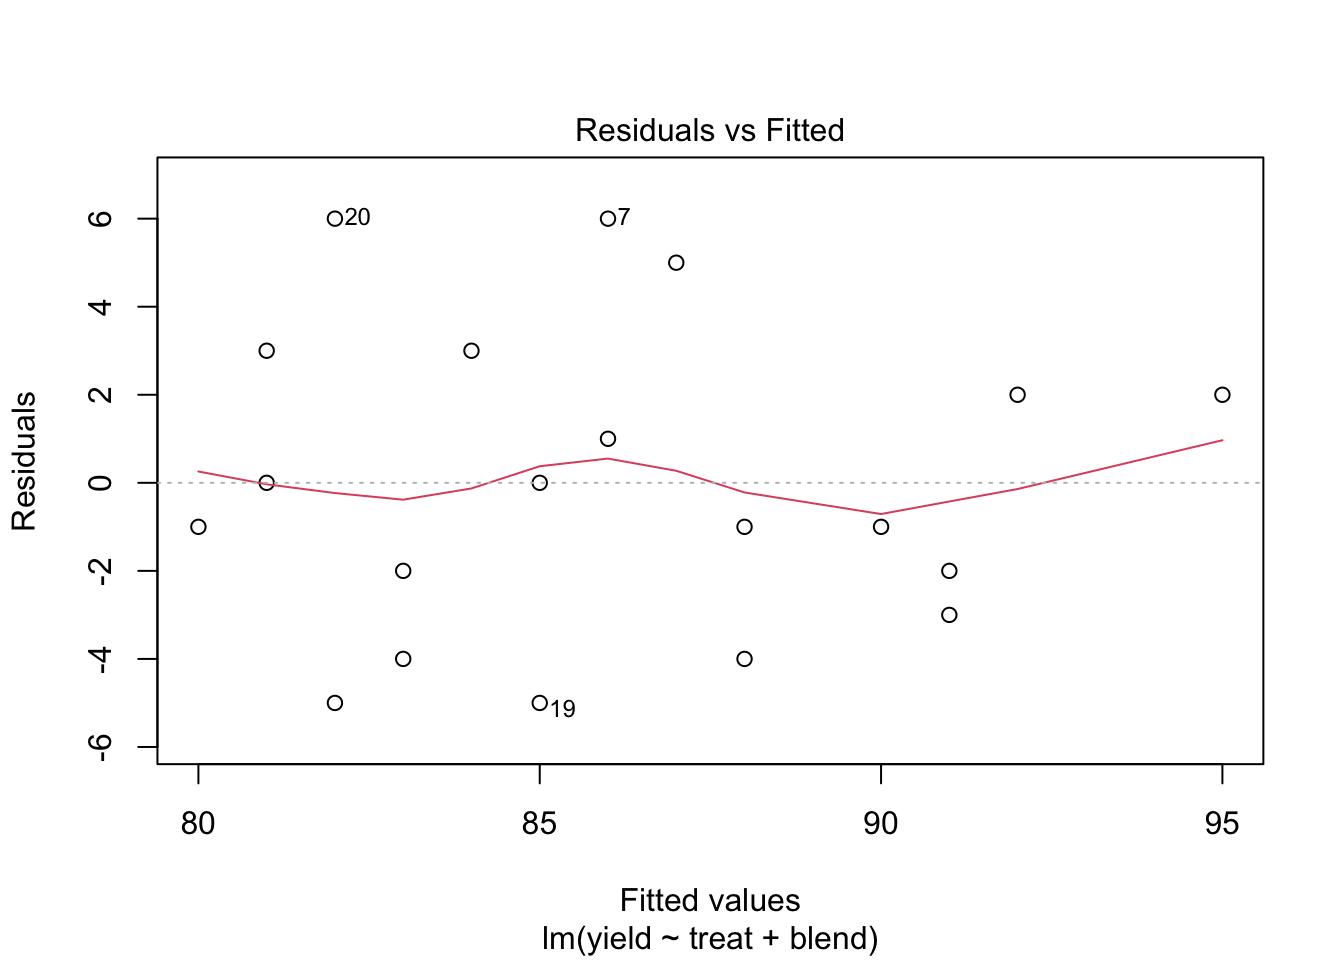
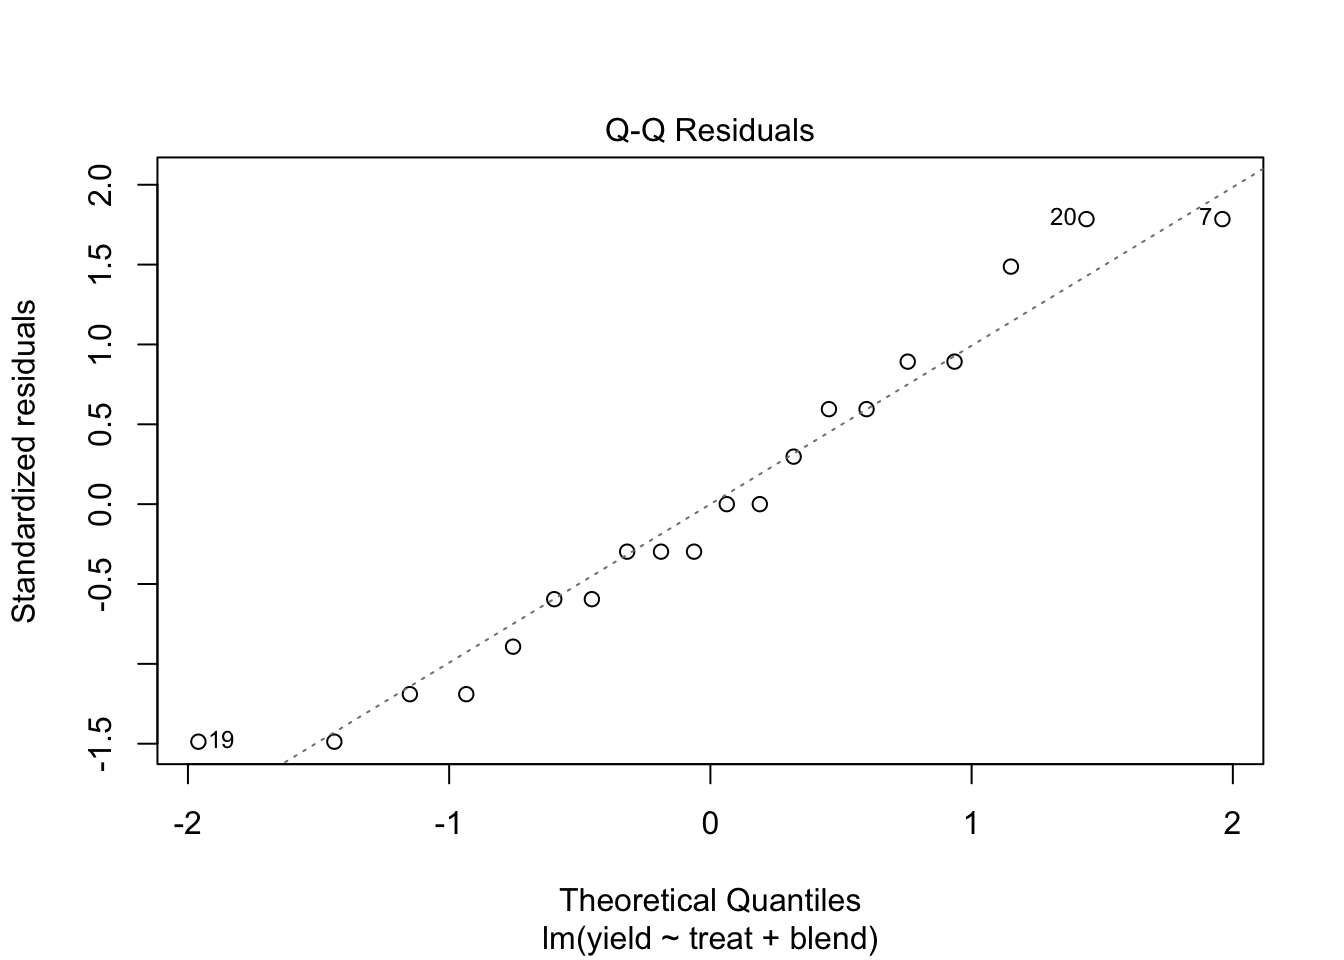
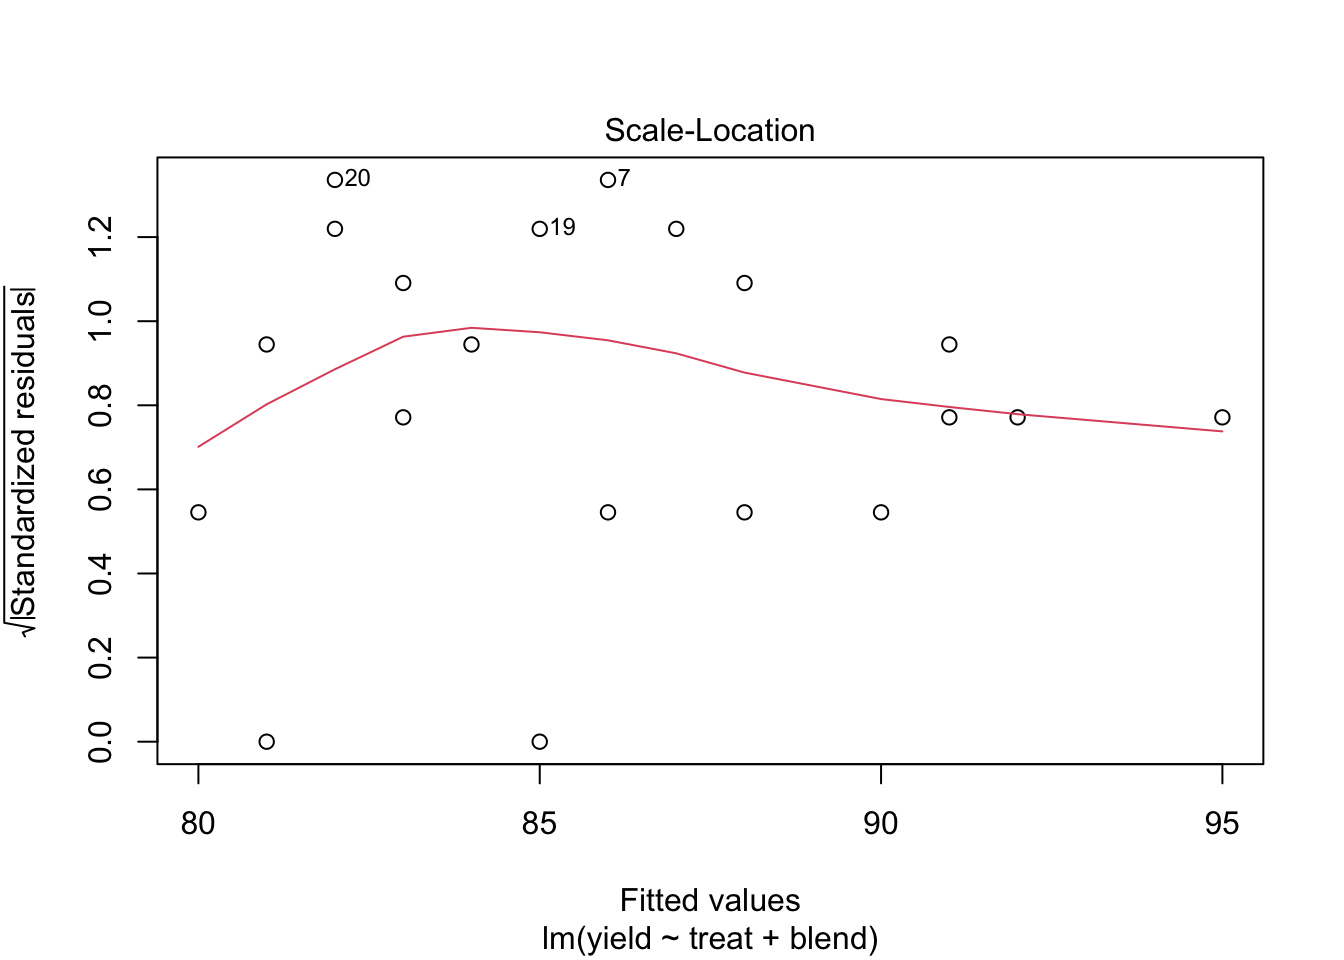
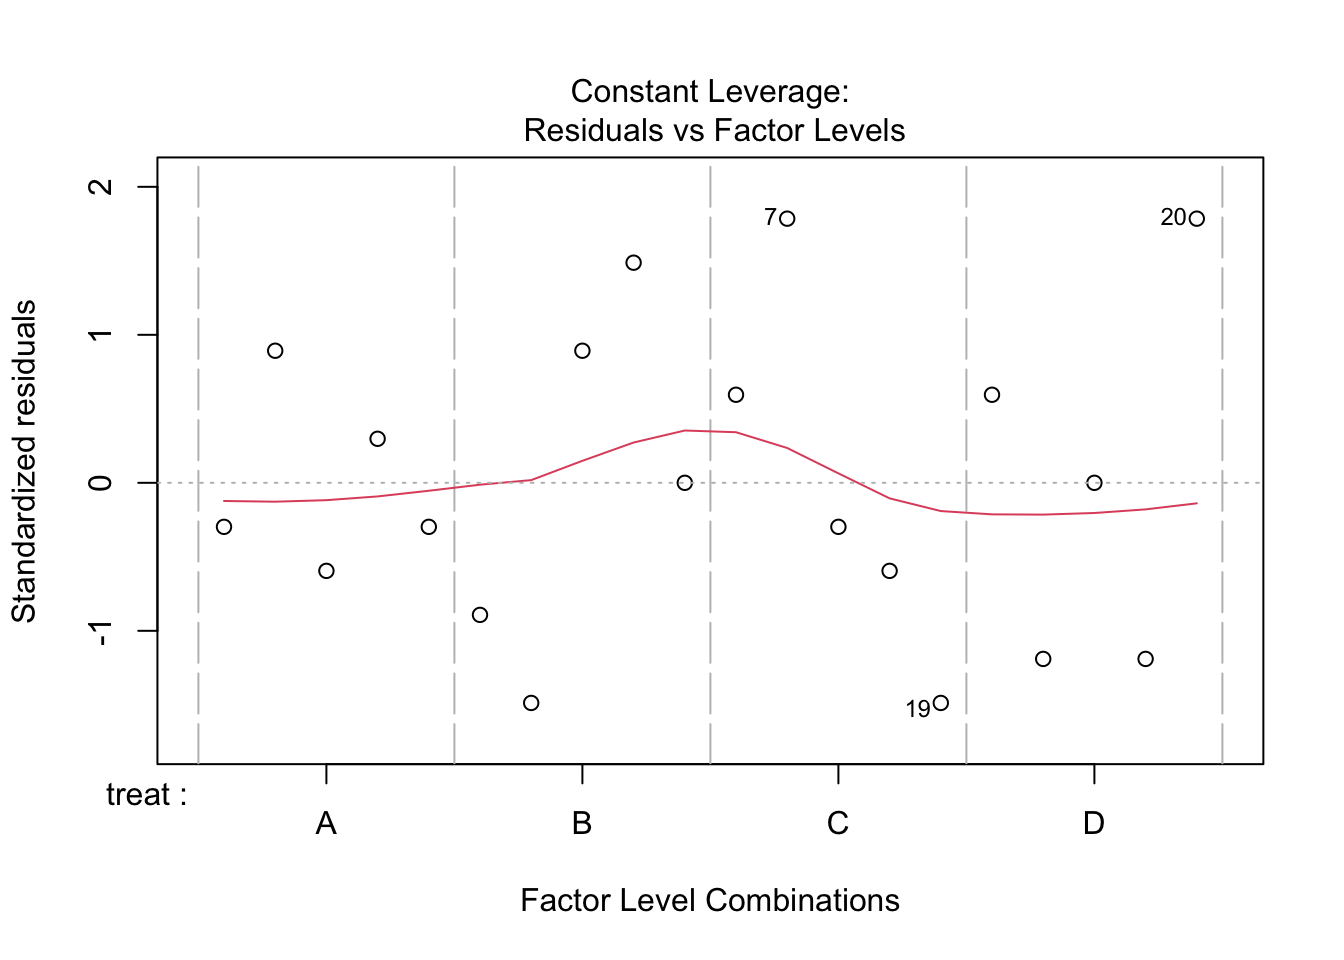
```{r}
lmPen <- lm(yield ~ treat + blend, data = penicillin)
plot(lmPen)
car::Anova(lmPen, type = "III")
```
We conclude that the effect of the treatment on the penicillin yield is not significant at the 5% level of significance (p = `r car::Anova(lmPen,type="III")["treat","Pr(>F)"] |> round(2)`.
We also observe that there is a large effect of the blend on the yield.
Blend explains about `r round(car::Anova(lmPen,type="III")["blend","Sum Sq"]/sum(car::Anova(lmPen,type="III")[-1,"Sum Sq"])*100,1)`% of the variability in the penicillin yield.
# Pseudo-replication
A study on the facultative pathogen Francisella tularensis was conceived by Ramond et al. (2015) [12].
- F. tularensis enters the cells of its host by phagocytosis.
- The authors showed that F. tularensis is arginine deficient and imports arginine from the host cell via an arginine transporter, ArgP, in order to efficiently escape from the phagosome and reach the cytosolic compartment, where it can actively multiply.
- In their study, they compared the proteome of wild type F. tularensis (WT) to ArgP-gene deleted F. tularensis (knock-out, D8).
- The sample for each bio-rep was run in technical triplicate on the mass-spectrometer.
- We will use data for the protein 50S ribosomal protein L5 [A0Q4J5](https://www.uniprot.org/uniprot/A0Q4J5)
## Data exploration
```{r}
franc <- read_tsv("https://raw.githubusercontent.com/statOmics/PSLSData/main/francisellaA0Q4J5.txt")
franc
```
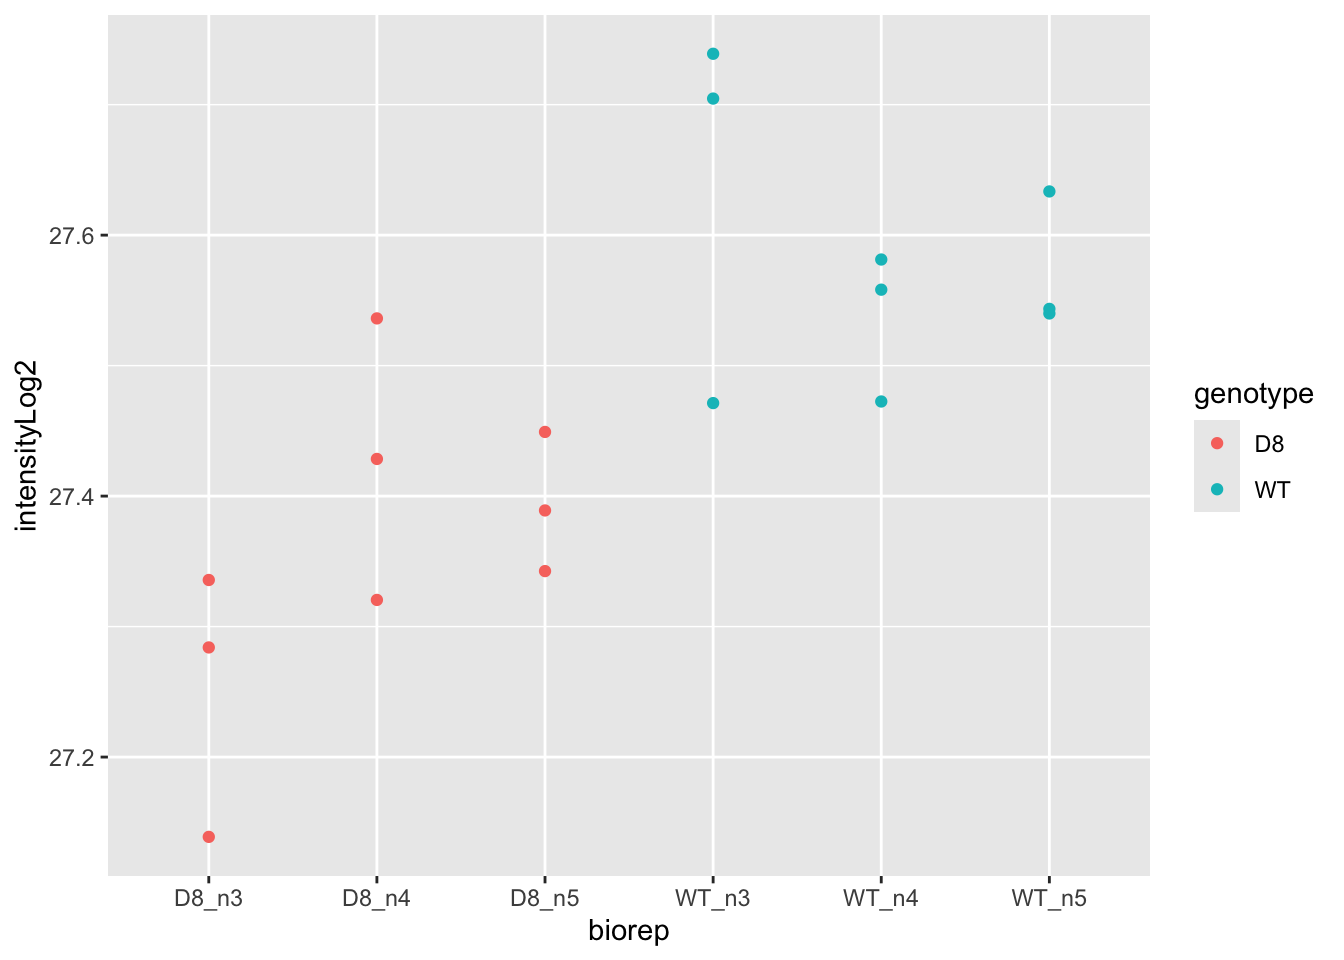
```{r}
franc |>
  ggplot(aes(biorep, intensityLog2, color = genotype)) +
  geom_point()
```
- Response?
- Experimental unit?
- Observational unit?
- Factors?
$\rightarrow$ Pseudo-replication, randomisation to bio-repeat and each bio-repeat measured in technical triplicate.
$\rightarrow$ If we would analyse the data using a linear model based on each measured intensity, we would act as if we had sampled 18 bio-repeats.
$\rightarrow$ Effect of interest has to be assessed between bio-repeats. So block analysis not possible!
If the same number of pseudo-replicates/technical replicates are available for each bio-repeat:
- average first over bio-repeats to obtain independent measurements
- averages will then have the same precision
- assess effect of treatment using averages
- **Caution: never summarize over bio-repeats/experimental units**
```{r}
lmBiorep <- lm(intensityLog2 ~ -1 + biorep, franc)
lmBiorep
```
```{r}
francSum <- data.frame(genotype = rep(c("D8", "WT"), each = 3) |> as.factor() |> relevel("WT"), intensityLog2 = lmBiorep$coef)
francSum
```
```{r}
lmSum <- lm(intensityLog2 ~ genotype, francSum)
summary(lmSum)
```
## Wrong analysis
```{r}
lmWrong <- lm(intensityLog2 ~ genotype, franc)
summary(lmWrong)
```
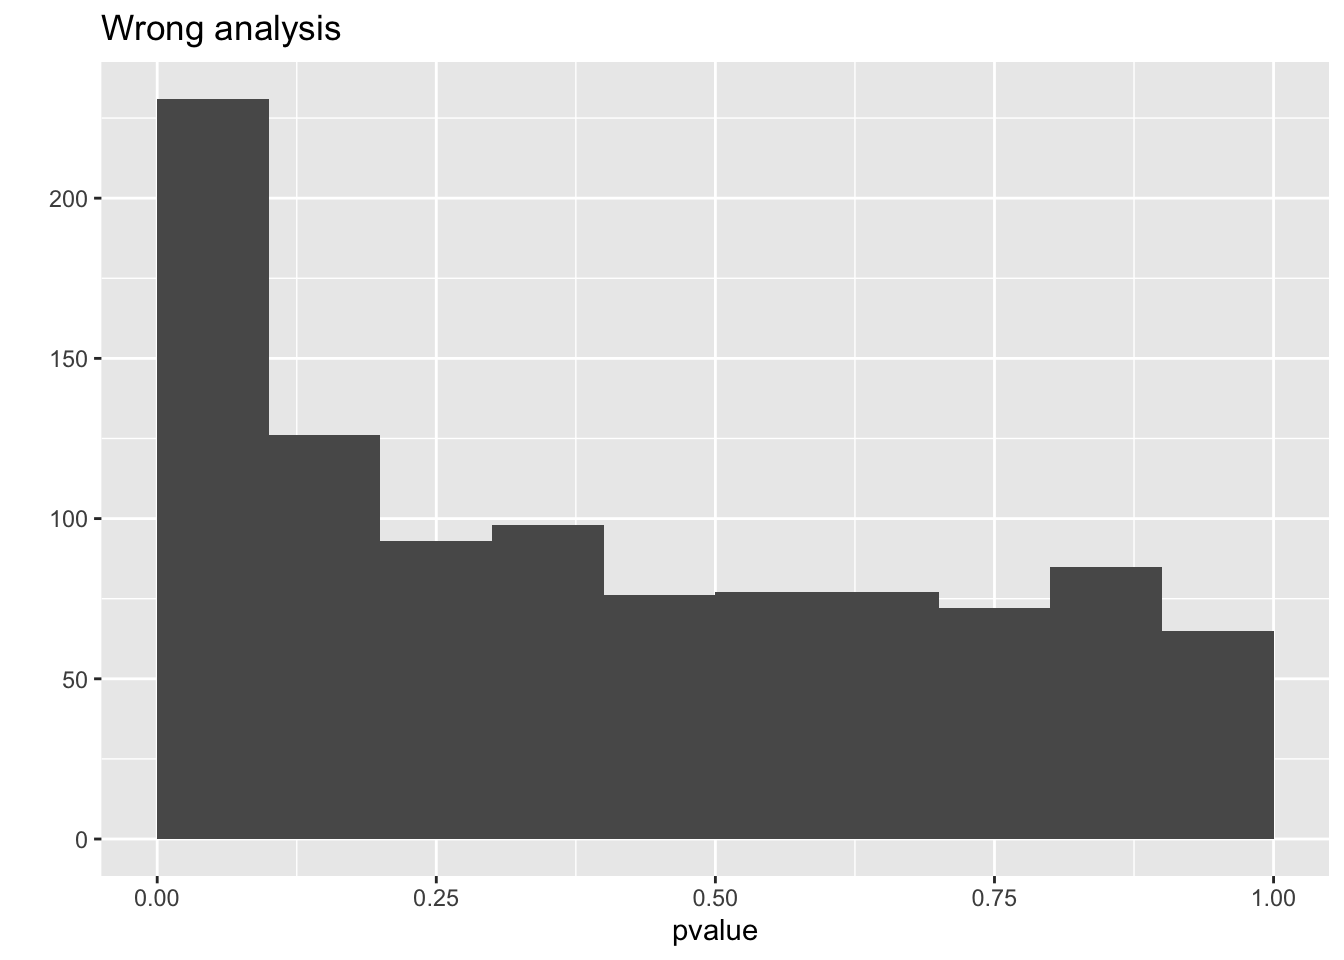
Note, that the analysis where we ignore that we have multiple technical repeats for each bio-repeat returns results that are much more significant because we act as if we have much more independent observations.
### No Type I error control!
```{r}
sigmaWithin <- sigma(lmBiorep)
sigmaBetween <- sigma(lmSum)
xBiorep <- model.matrix(~ -1 + biorep, franc)
xWrong <- model.matrix(~genotype, franc)


set.seed(2523)
nSim <- 1000
resWrong <- matrix(NA, nSim, 4) |> as.data.frame()
names(resWrong) <- c("Estimate", "Std. Error", "t value", "pvalue")
resCorrect <- resWrong
genotype <- franc$genotype
genotypeSum <- francSum$genotype
biorep <- franc$biorep

for (i in 1:nSim)
{
  biorepSim <- rnorm(ncol(xBiorep), sd = sigmaBetween)
  ySim <- xBiorep %*% biorepSim + rnorm(nrow(xBiorep), sd = sigmaWithin)
  ySum <- lm(ySim ~ biorep)$coefficient
  resWrong[i, ] <- summary(lm(ySim ~ genotype))$coefficient[2, ]
  resCorrect[i, ] <- summary(lm(ySum ~ genotypeSum))$coefficient[2, ]
}
mean(resCorrect$pvalue < 0.05)
mean(resWrong$pvalue < 0.05)
```
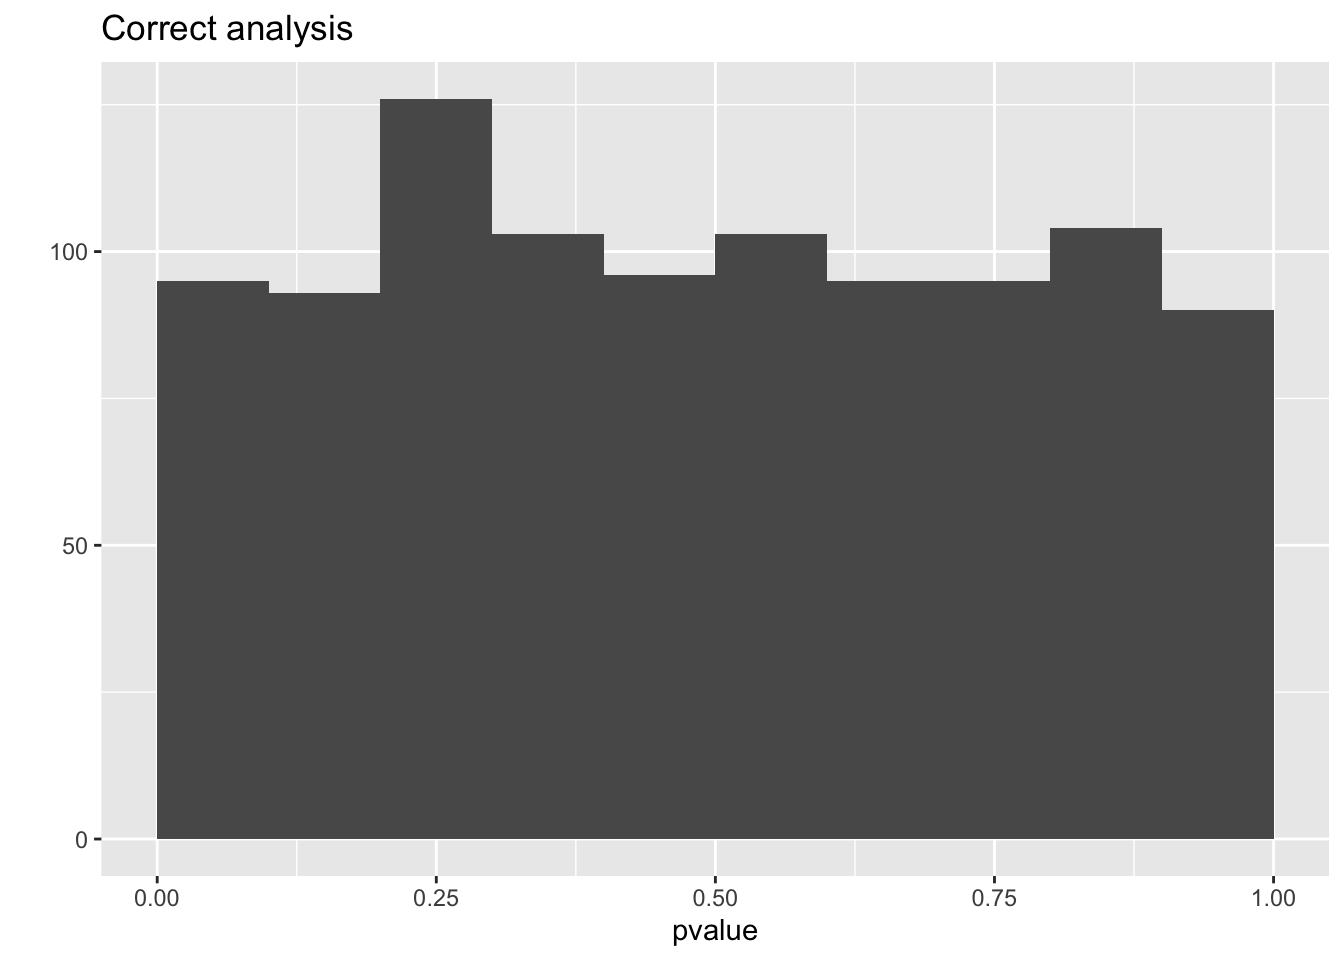
```{r}
qplot(resCorrect$pvalue, geom = "histogram", boundary = c(0, 1)) +
  stat_bin(breaks = seq(0, 1, .1)) +
  xlab("pvalue") +
  ggtitle("Correct analysis")
qplot(resWrong$pvalue, geom = "histogram", boundary = c(0, 1)) +
  stat_bin(breaks = seq(0, 1, .1)) +
  xlab("pvalue") +
  ggtitle("Wrong analysis")
```
- So we observe that the analysis that does not account for pseudo-replication is too liberal!
- The analysis that first summarizes over the technical repeats leads to correct p-values and correct type I error control!
- What to do when you have an unequal number of technical repeats: more advanced methods are required
- e.g. mixed models
- The mixed model framework can model the correlation structure in the data
- Mixed models can also be used when inference between and within blocks is needed, e.g. split-plot designs.
- But, mixed models are beyond the scope of the lecture series.
# Nature methods: Split-plot designs
[Nature Methods - Point of Significance - Split-plot Designs](https://www.nature.com/articles/nmeth.3293.pdf)