---
title: Analysis of prostacyclin experiment
author: Lieven Clement
---
# Background
Researchers study the effect of arachidonic acid on prostacyclin level in blood plasma. They use 3 different doses of arachidonic acid: low (10 units), medium (25 units) and high dose (50 units) and measure the prostacycline levels in blood plasma using an elisa fluorescence measurement. Treatments are randomly assigned to rats and every rat originates from a different litter and is grown in a separate cage.
```{r}
library("tidyverse")
```
# Experimental design
- There is one explanatory variable: the factor dose
- There are three treatments: low, medium and high dose of arachidonic acid
- The effect of the treatments is assessed on the response variable prostacyclin level in blood plasma
- The rats are the experimental and observational units
- The experiment is a completely randomized design (CRD)
- Researchers are interested to assess if there is an effect of the arachidonic acid dose on the prostacyclin level and when there is an effect, they want to asssess for which dose levels significantly different effects occur.
# Data
The data can be found in a table of Voorbeeld 5.23 in the bachelor cours of statistics.
```{r}
prostacyclin <- data.frame(
    prostac=c(19.2, 10.8, 33.6, 11.9, 15.9, 33.3, 81.1, 36.7, 58.0, 60.8, 50.6, 69.4, 30.8, 27.6, 13.2, 38.8, 37.0, 38.3, 65.2, 66.4, 63.2, 49.9, 89.5, 60.5, 102.9, 57.1, 76.7, 70.5, 66.4, 76.3, 83.1, 61.7, 101.5, 86.2, 115.9, 102.1),
    dose=factor(c(rep(10,12),rep(25,12),rep(50,12))))
```
# Analysis
One-way anova to assess if there is an effect of the treatment. Tukey post-hoc test to assess pairwise differences between the treatment.
## One-way anova
### Data exploration
```{r}
prostacyclin |>
  ggplot(aes(x=dose, y=prostac)) +
  geom_boxplot(outlier.shape = NA) +
  geom_point(position = "jitter")
prostacyclin |>
  ggplot(aes(sample=prostac)) +
  geom_qq() +
  geom_qq_line() +
  facet_grid(cols = vars(dose))
```
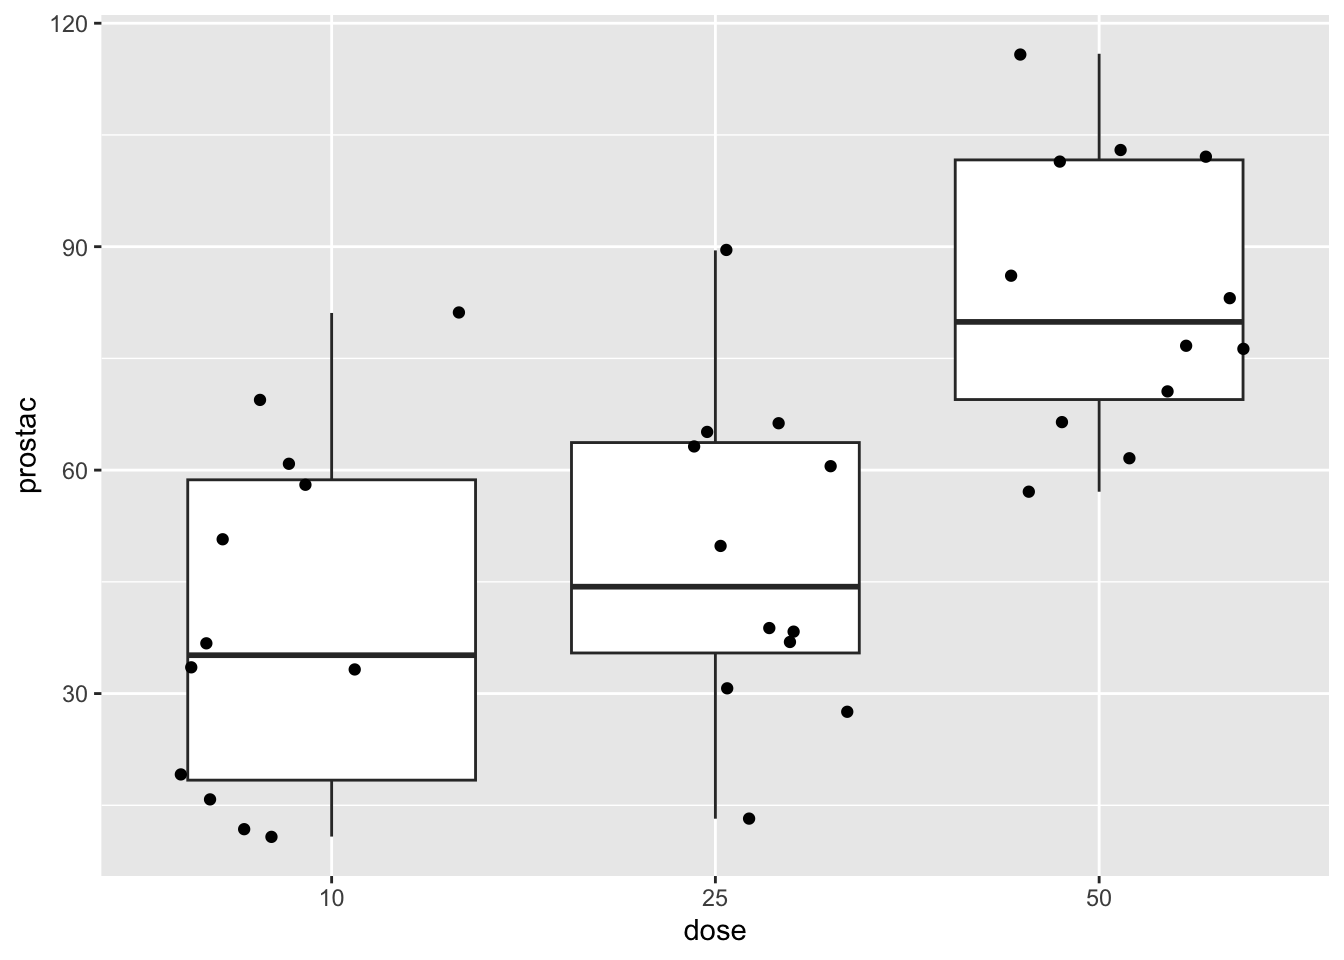
- The boxplots show that the data are homoscedastic
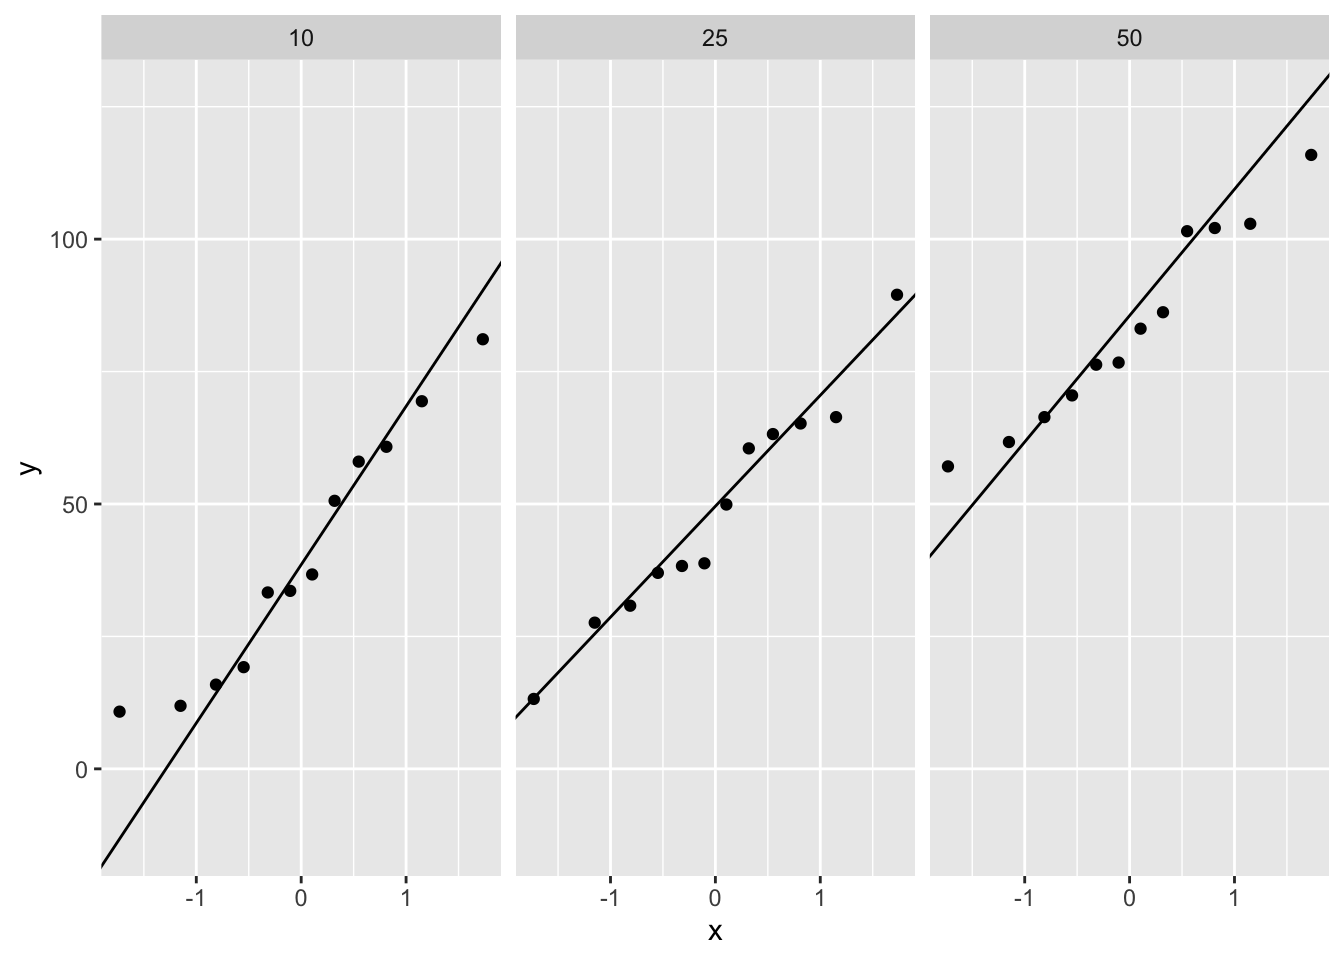
- The qq-plot show no severe deviations from normality
### Anova
- H0: On average there is no effect of the arachidonic acid treatment on the prostacyclin level in blood serum of rats
- H1: The average prostacyclin level in blood serum of rats is different for at least two arachidonic dose levels
```{r}
library(car)
library(multcomp)
lm1 <- lm(prostac~dose,data=prostacyclin)
Anova(lm1,type=3)
```
There is an extremely significant effect of arachidonic acid on the average prostacyclin blood concentration in rats (p<0.001).
### Post-hoc
```{r}
tukey <- glht(lm1,linfct=mcp(dose="Tukey"))
summary(tukey)
confint(tukey)
```
The average prostacyclin concentration is higher in the high dose group than in the low and moderate dose group (both p-values are smaller than p<0.001).
The average concentration in the high dose group is `r round(summary(tukey)$test$coef[2],1)` ng/ml (95% CI [`r round(confint(tukey)$confint[2,c("lwr","upr")],1)`]) and `r round(summary(tukey)$test$coef[3],1)` ng/ml (95% CI [`r round(confint(tukey)$confint[3,c("lwr","upr")],1)`]) higher than in the low and moderate dose group, respectively (both p<0.001).
The difference in average prostacyclin concentration between the moderate and low dose group is not significant (p=`r round(summary(tukey)$test$pvalues[1],2)`, 95% CI on average difference [`r round(confint(tukey)$confint[1,c("lwr","upr")],1)`] ng/ml).
# Conclusion
There is an extremely significant effect of arachidonic acid on the average prostacyclin blood concentration in rats (p<0.001).
The average concentration in the high dose group is `r round(summary(tukey)$test$coef[2],1)` ng/ml (95% CI [`r round(confint(tukey)$confint[2,c("lwr","upr")],1)`]) and `r round(summary(tukey)$test$coef[3],1)` ng/ml (95% CI [`r round(confint(tukey)$confint[3,c("lwr","upr")],1)`]) higher than in the low and moderate dose group, respectively (both p<0.001).
The difference in average prostacyclin concentration between the moderate and low dose group is not significant (p=`r round(summary(tukey)$test$pvalues[1],2)`, 95% CI on average difference [`r round(confint(tukey)$confint[1,c("lwr","upr")],1)`] ng/ml).