satuRn is a highly performant and scalable method for performing differential transcript usage analyses.
NEWS
We report a bug in satuRn 1.4.0. (Bioconductor release 3.15). The bug was inadvertently introduced in satuRn 1.3.1 (from the former Bioconductor devel). Note that the bug was not thus present in any of the older Bioconductor releases 3.13 and 3.14 (satuRn 1.0.x, 1.1.x and 1.2.x).
The bug has been resolved in the newer versions of satuRn (1.4.1 and up). Therefore, satuRn 1.4.0. should no longer be used and updated to the newer version. For more details on the bug, we refer to the NEWS
Installation instructions
To install the current version of satuRn in Bioconductor, run;
if(!requireNamespace("BiocManager", quietly = TRUE)) {
 install.packages("BiocManager")
}
BiocManager::install("satuRn")
To install the development version, run;
devtools::install_github("statOmics/satuRn")The installation should only take a few seconds. The dependencies of the package are listed in the DESCRIPTION file of the package.
Issues and bug reports
Please use https://github.com/statOmics/satuRn/issues to submit issues, bug reports, and comments.
Usage
! See the online vignette on the bioconductor website or the satuRn website for a more elaborate and reproducible example.
A minimal example of the different functions for modelling, testing and visualizing differential transcript usage is provided here.
Provide a transcript expression matrix and corresponding colData and rowData
sumExp <- SummarizedExperiment::SummarizedExperiment(
    assays = list(counts = Tasic_counts_vignette),
    colData = Tasic_metadata_vignette,
    rowData = txInfo
)

# Specify design formula from colData
metadata(sumExp)$formula <- ~ 0 + as.factor(colData(sumExp)$group)
Next, we test for differential transcript usage with the function testDTU. This function takes as input the SummarizedExperiment object generated by fitDTU and a contrast matrix or vector. The latter is used to specify the comparison(s) of interest and can either be generated manually or automatically with the makeContrasts function of the limma R package.
group <- as.factor(Tasic_metadata_vignette$group)
design <- model.matrix(~ 0 + group) # constructs design matrix
colnames(design) <- levels(group)
L <- limma::makeContrasts(Contrast1 = VISp.L5_IT_VISp_Hsd11b1_Endou - ALM.L5_IT_ALM_Tnc,
                          Contrast2 = VISp.L5_IT_VISp_Hsd11b1_Endou - ALM.L5_IT_ALM_Tmem163_Dmrtb1,
                          levels = design) # constructs contrast matrix

sumExp <- satuRn::testDTU(object = sumExp,
                          contrasts = L,
                          plot = FALSE,
                          sort = FALSE)
The test results are now saved into the rowData of our SummarizedExperiment object under the name fitDTUResult_ followed by the name of the contrast of interest (i.e. the column names of the contrast matrix). The results can be accessed as follows:
Finally, we may visualize the usage of select transcripts in select groups of interest with plotDTU:
sumExp <- satuRn::testDTU(
    object = sumExp,
    contrasts = L,
    plot = FALSE,
    sort = FALSE
)
Finally, we may visualize the usage of select transcripts in select groups of interest with plotDTU:
group1 <- colnames(sumExp)[colData(sumExp)$group == "VISp.L5_IT_VISp_Hsd11b1_Endou"]
group2 <- colnames(sumExp)[colData(sumExp)$group == "ALM.L5_IT_ALM_Tnc"]

plots <- satuRn::plotDTU(
    object = sumExp,
    contrast = "Contrast1",
    groups = list(group1, group2),
    coefficients = list(c(0, 0, 1), c(0, 1, 0)),
    summaryStat = "model",
    transcripts = c(
        "ENSMUST00000081554",
        "ENSMUST00000195963",
        "ENSMUST00000132062"
    ),
    genes = NULL,
    top.n = 6
)
# Example plot from our publication:
knitr::include_graphics("https://raw.githubusercontent.com/statOmics/satuRn/master/inst/figures/README-DTU_plot.png")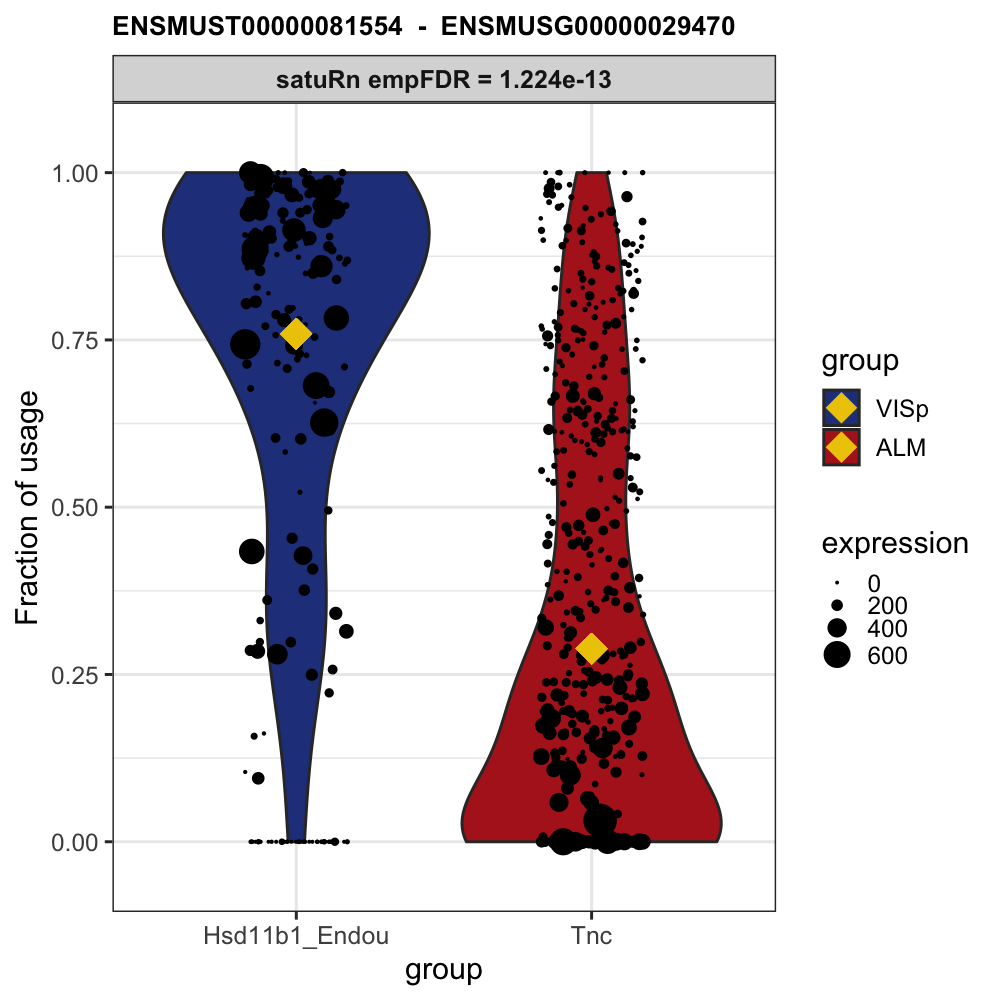
Citation
Below is the citation output from using citation('satuRn') in R. Please run this yourself to check for any updates on how to cite satuRn.
##
## Gilis J (2023). _Scalable Analysis of differential Transcript Usage for
## bulk and single-Cell RNA-sequencing applications_. doi:
## 10.18129/B9.bioc.satuRn (URL: https://doi.org/10.18129/B9.bioc.satuRn),
## https://github.com/statOmics/satuRn - R package version 1.7.2, <URL:
## http://www.bioconductor.org/packages/satuRn>.
##
## A BibTeX entry for LaTeX users is
##
##   @Manual{,
##     title = {Scalable Analysis of differential Transcript Usage for bulk and single-Cell RNA-sequencing applications},
##     author = {Jeroen Gilis},
##     year = {2023},
##     url = {http://www.bioconductor.org/packages/satuRn},
##     note = {https://github.com/statOmics/satuRn - R package version 1.7.2},
##     doi = {10.18129/B9.bioc.satuRn},
##   }
##
## Gilis J, Vitting-Seerup K, Van den Berge K, Clement L (2021). "Scalable
## Analysis of Differential Transcript Usage for Bulk and Single-Cell
## RNA-sequencing Applications." _F1000_. doi:
## (https://doi.org/10.12688/f1000research.51749.1 (URL:
## https://doi.org/%28https%3A//doi.org/10.12688/f1000research.51749.1),
## <URL: https://f1000research.com/articles/10-374/v1>.
##
## A BibTeX entry for LaTeX users is
##
##   @Article{,
##     title = {Scalable Analysis of Differential Transcript Usage for Bulk and Single-Cell RNA-sequencing Applications},
##     author = {Jeroen Gilis and Kristoffer Vitting-Seerup and Koen {Van den Berge} and Lieven Clement},
##     year = {2021},
##     journal = {F1000},
##     doi = {(https://doi.org/10.12688/f1000research.51749.1},
##     url = {https://f1000research.com/articles/10-374/v1},
##   }
Please note that the satuRn was only made possible thanks to many other R and bioinformatics software authors, which are cited either in the vignettes and/or the paper(s) describing this package.
Code of Conduct
Please note that the satuRn project is released with a Contributor Code of Conduct. By contributing to this project, you agree to abide by its terms.
Development tools
- Continuous code testing is possible thanks to GitHub actions through usethis, remotes, and rcmdcheck customized to use Bioconductor’s docker containers and BiocCheck.
- Code coverage assessment is possible thanks to codecov and covr.
- The documentation website is automatically updated thanks to pkgdown.
- The code is styled automatically thanks to styler.
- The documentation is formatted thanks to devtools and roxygen2.
For more details, check the dev directory.
This package was developed using biocthis.